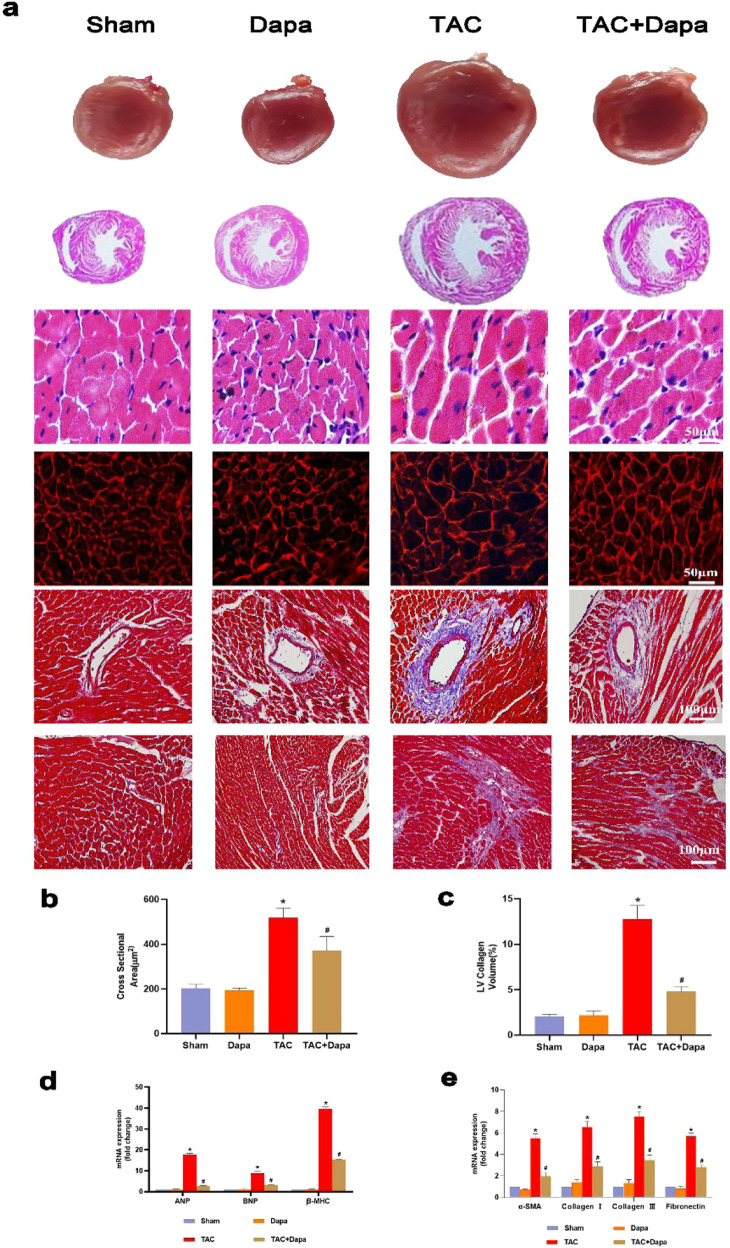
Fig. 2. Effect of treatment with dapagliflozin (DAPA) on transverse aortic constriction (TAC)-induced cardiac hypertrophy in mice.
a Representative images of the morphological analysis of cardiac hypertrophy as reflected by the whole heart and heart short-axis cross-section (top), hematoxylin and eosin (H&E) staining (middle), fluorescein isothiocyanate-labeled wheat germ agglutinin (WGA) staining (middle), and Masson’s trichrome (MASSON) staining (bottom). b Statistical data of the cardiomyocyte cross-sectional areas. c LV collagen ratio in interstitial fibrosis. d ANP, BNP and β-MHC mRNA levels were assessed by real-time PCR. e α-SMA, collagen I, collagen III and fibronectin mRNA levels were determined by real-time PCR. n = 6, ∗P < 0.05 versus the sham or DAPA group, #P < 0.05 versus the TAC group.

