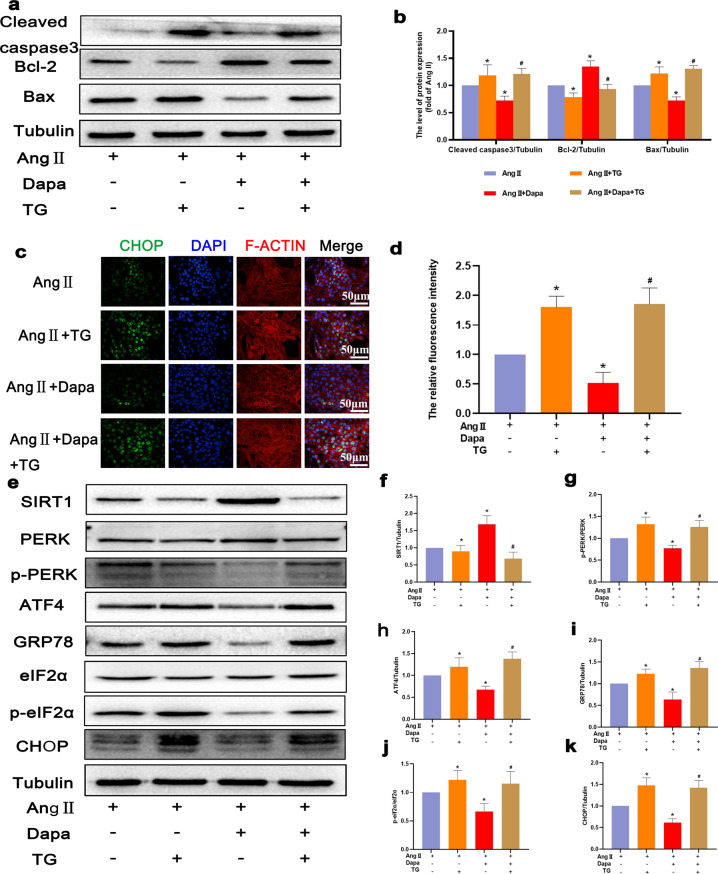
Fig. 6. DAPA inhibited ER stress in Ang II-induced cardiomyocytes.
a, b The protein levels of Bcl-2, Bax, and cleaved caspase 3 in each group were detected. c CHOP immunofluorescence staining. Markedly increased green bright puncta indicated the upregulated expression of CHOP. d Quantification of the number of CHOP-positive chondrocytes in each group based on immunofluorescence staining. e–k The protein expression levels and optical density analysis of SIRT1, p-PERK, ATF4, GRP-78, p-eIF2α, and CHOP in the myocardium. n = 6, ∗P < 0.05 versus the Ang II or Ang II + TG group, #P < 0.05 versus the Ang II + DAPA group.

