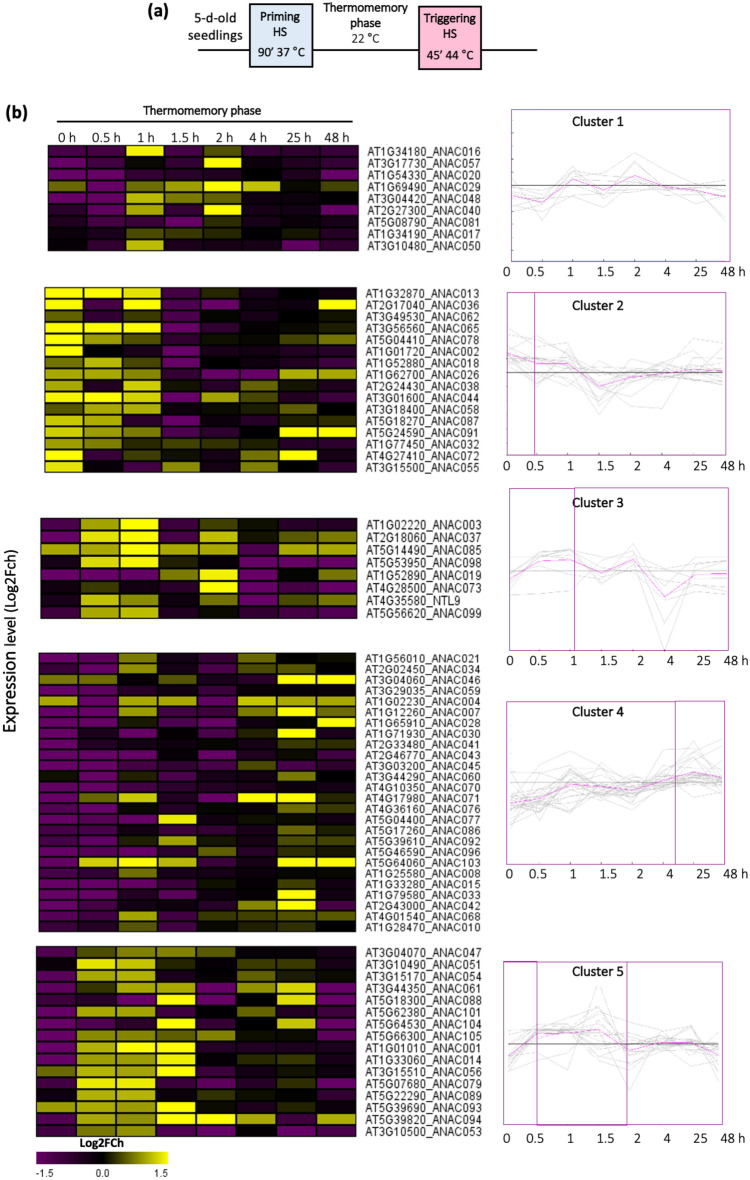
Figure 1.
Expression of NAC transcription factors during the memory phase, after heat priming. (a) Schematic representation of the heat stress (HS) regime applied to asses HS memory. (b) Heat map and k-means clustering (k = 5 clusters) of NACs, based on their change in expression (HS samples compared to unstressed controls) during the memory phase at the time points indicated in the representation in (a). The color indicates the expression ratio as log2-fold change for the different time points, where ‘yellow’ denotes an increased expression and ‘purple’ a reduced expression. The list of genes in each cluster and their expression values are shown in Supplementary Table S1.

