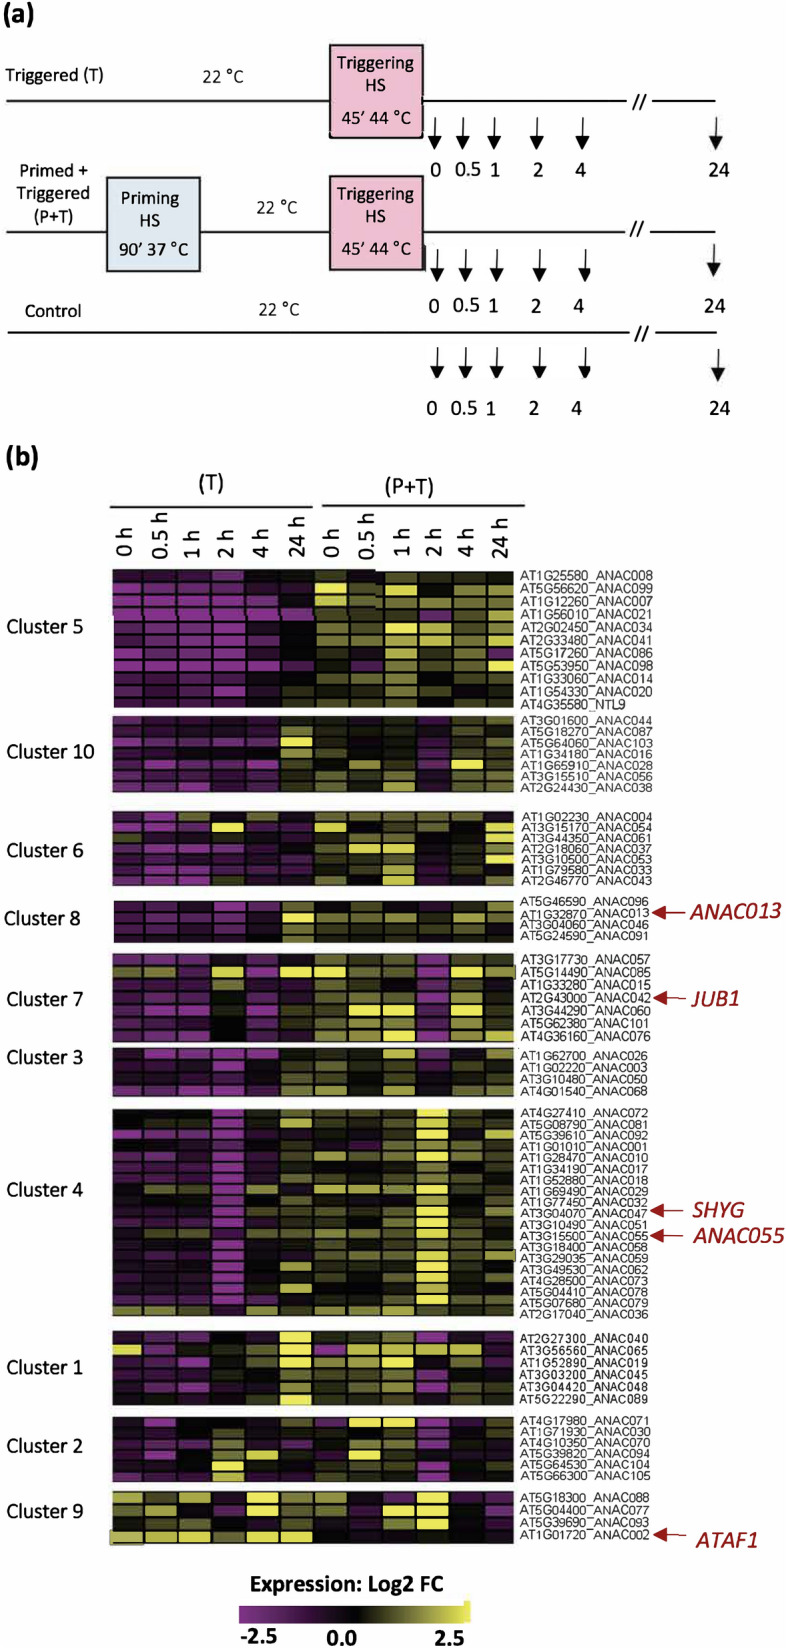
Figure 2.

Expression of NACs after a triggering stimulus. (a) Schematic representation of the time points used for expression analysis of NACs in triggered plants (T), and in plants that were primed before triggering (P + T). In triggered (T) plants, the expression was calculated as a ratio of HS samples compared to unstressed controls. In primed and triggered (P + T) plants, the expression was calculated as primed and triggered (P + T), compared to triggered only (T). (b) K-means clustering of NAC expression profiles of primed and triggered (P + T) and triggered (T) plants after the triggering stimulus (k = 10 clusters). The expression of genes in each cluster is displayed as a heat map. The color indicates the expression as log2-fold change for the different time points, where yellow denotes an increased expression and purple a reduced expression. The list of genes in each cluster and their expression values are shown in Supplementary Table S2.
