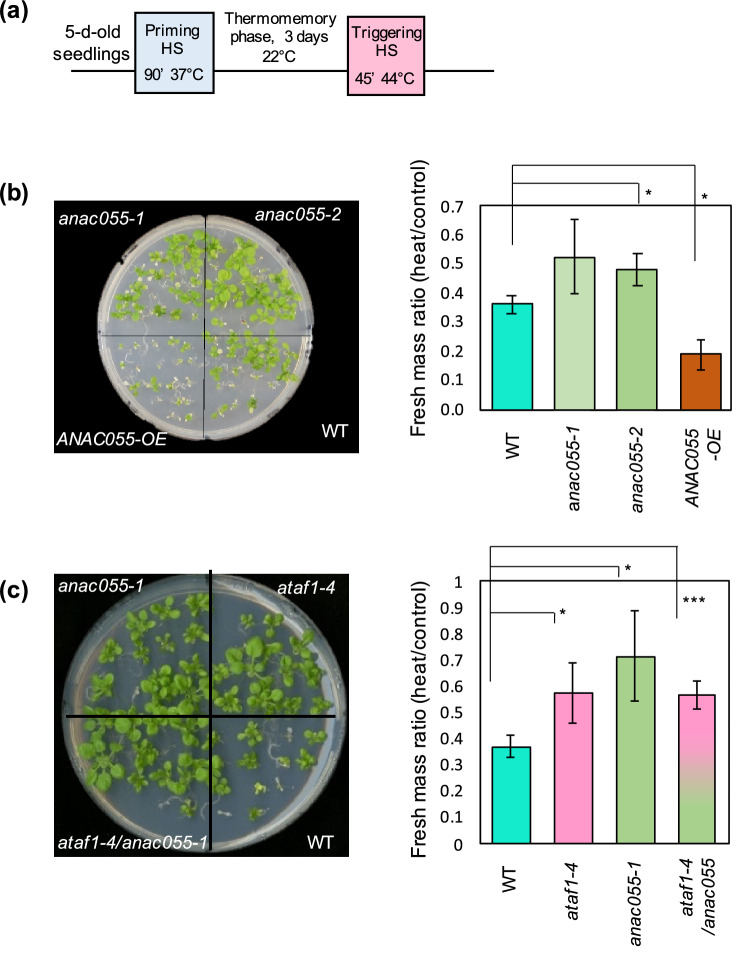
Figure 7.
Thermomemory is improved in the ataf1–4/anac055 double-knockout mutant compared to WT. (a) Schematic representation of HS regime. (b) Thermomemory phenotype of ANAC055-OE, anac055-1 and anac055-2 mutants, and WT plants. (c) Thermomemory phenotype of ATAF1-OE, ataf1–4 mutant, ataf1–4/anac055 double-mutant, and WT plants. Seedlings were exposed to the HS regime shown in (a). Left panels: seedlings photographed 14 days after exposure to the triggering heat stress. The phenotype of one representative replicate of at least three (b) or five (c) independent biological replicates is shown. Right panels: seedling fresh mass upon heat stress, compared to control plants (no heat stress). Error bars represent standard deviation, which was calculated from three biological replicates, where each replicate was the average mass of 18–19 seedlings. Significant differences between transgenic lines and WT plants were calculated using Student’s t-test; * if P < 0.05; *** if P < 0.001.

