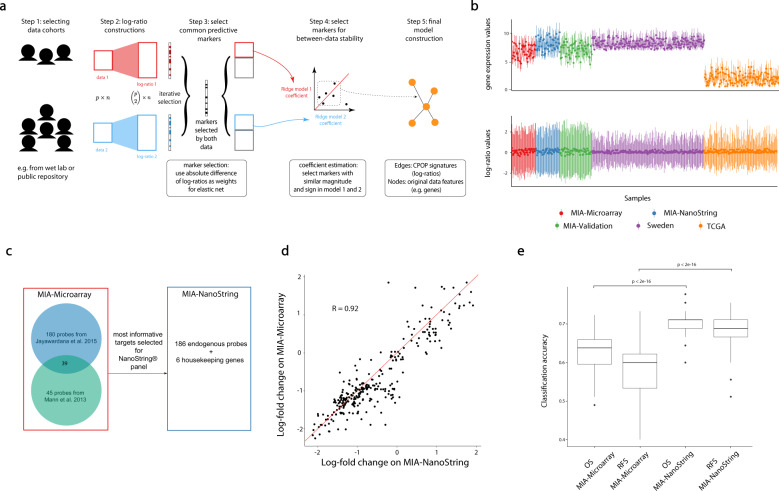
Fig. 1. Overview of CPOP and the motivating melanoma dataset.
a Schematic illustration of the five-step CPOP procedure with emphasis on the stable selection of features in Steps 3 and 4. b Quartile plot of the expression values of all genes (top panel) and all pairwise (bottom panel) log-ratio features for each sample (n = 488) in the melanoma data collection. Each sample is represented by the median (a single solid point), the first quartile (the lower end of a vertical line) and the third quartile (the upper end of a vertical line) of all the gene/feature values for that sample. c NanoString probe selection (186 probes) based on results from our previous microarray studies7,14. d Scatter plot of log fold-change for genes common between MIA-Microarray and MIA-NanoString. e Boxplot comparisons of overall accuracy for overall survival (OS) and recurrence-free survival (RFS) between the MIA-Microarray and MIA-NanoString data. The y-axis shows the classification accuracy calculated from 100 repeated 5-fold cross-validation using a support vector machine classifier. The good/poor prognosis classes for overall survival (OS) and recurrence-free survival (RFS) are defined in Methods. The centreline of a boxplot denotes the median classification accuracy, and the lower and upper bounds of the box denote the first and third quartile values, respectively. The lower and upper whiskers denote 1.5 times the interquartile range away from the first and third quartile values, respectively.

