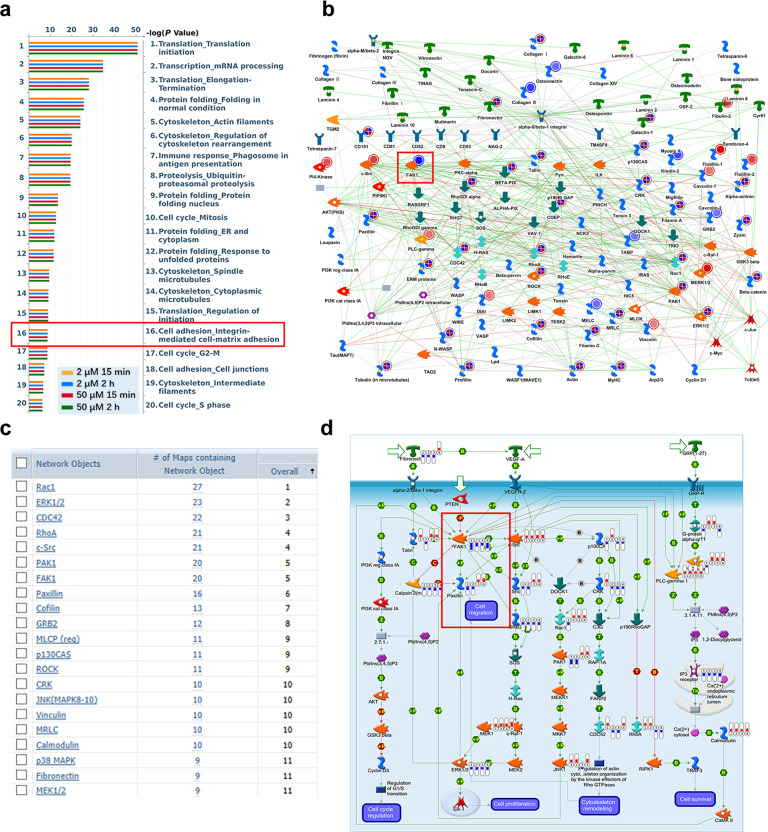
Fig. 5. Proteomics analysis of proteins differentially expressed in ADT-OH-treated cells.
a MetaCoreTM GeneGo Pathway Maps was used to analyze the ontological categories of differentially expressed proteins in MEF cells treated with or without ADT-OH. b The protein network associated with cell adhesion and migration is differentially expressed in MEF cells treated with ADT-OH. Higher definition image is shown in Supplementary Fig. 8. c The network objects involved in Pathway Maps analyzed by MetaCoreTM GeneGo Pathway Maps software. d The GeneGO pathway shows changes in the expression of proteins involved in FAK/Paxillin signaling. The various proteins on the map are represented by different symbols (representing the functional categories of proteins). Higher definition image is shown in Supplementary Fig. 10. The symbol next to the thermometer shaded in blue or red indicates the protein identified in this study: blue indicates the protein that is downregulated in ADT-OH treated MEF cells relative to MEF negative control cells (treated with vehicle). Red represents up-regulated protein.

