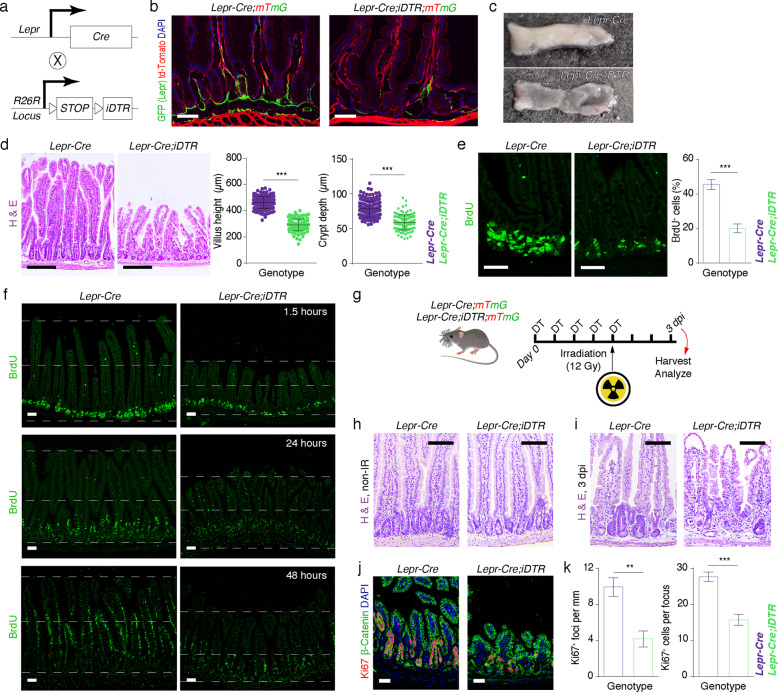
Fig. 2. Ablation of Lepr+ cells led to disrupted intestinal homeostasis and regeneration.
a Schematic diagram of the generation of Lepr-Cre;iDTR mice. b Fluorescence images showing ablation of Lepr+ cells (green) in the jejunum from Lepr-Cre;iDTR;mTmG mice (n = 4). Mice were injected intraperitoneally with diphteria toxin (DT) for 5 consecutive days. Scale bar, 50 μm. c Gross images of intestinal mucosa from Lepr-Cre and Lepr-Cre;iDTR mice (n = 4). Mice were injected intraperitoneally with DT for 10 consecutive days. d Histology of intestine from Lepr-Cre and Lepr-Cre;iDTR mice after 10 days of DT treatment. Villus length and crypt depth were quantified. Lepr-Cre, n = 160 villi, n = 176 crypts, n = 5 mice; Lepr-Cre;iDTR, n = 105 villi, n = 122 crypts, n = 5 mice. Scale bar, 200 μm. e Immunofluorescence for BrdU in the jejunum from Lepr-Cre and Lepr-Cre;iDTR mice after a 90-min pulse of BrdU. The percentages of BrdU+ epithelial cells per crypt were quantified. Lepr-Cre, n = 120 crypts, n = 3 mice; Lepr-Cre;iDTR, n = 120 crypts, n = 3 mice. Scale bar, 50 μm. f Immunofluorescence for BrdU in intestines from Lepr-Cre and Lepr-Cre;iDTR mice at the indicated time points after BrdU pulse. The dashed lines mark the top of the villi, middle line of the intestine, and the base of the crypt, respectively. Scale bar, 25 μm. n = 3 for each time point. g Schematic representation of experimental design for irradiation-mediated injury in Lepr-Cre and Lepr-Cre;iDTR mice. h Histology of intestines from Lepr-Cre and Lepr-Cre;iDTR mice before irradiation (n = 3). Scale bar, 100 μm. i Histology of intestines from Lepr-Cre and Lepr-Cre;iDTR mice 3 days after exposure of 12 Gy γ-irradiation (γ-IR). Mice were pre-treated with DT for 5 consecutive days before irradiation (n = 5). Scale bar, 100 μm. j Immunofluorescence of Ki67 and β-Catenin in intestines of Lepr-Cre and Lepr-Cre;iDTR mice 3 days after 12 Gy γ-IR (n = 3). Scale bar, 50 μm. k Quantification of Ki67+ regenerative foci and the number of Ki67+ cells per focus in j. Values in the graphs represent means ± SD. Unpaired Student’s t-test was used for calculating P values in d, e, and k. **P < 0.01; ***P < 0.001.

