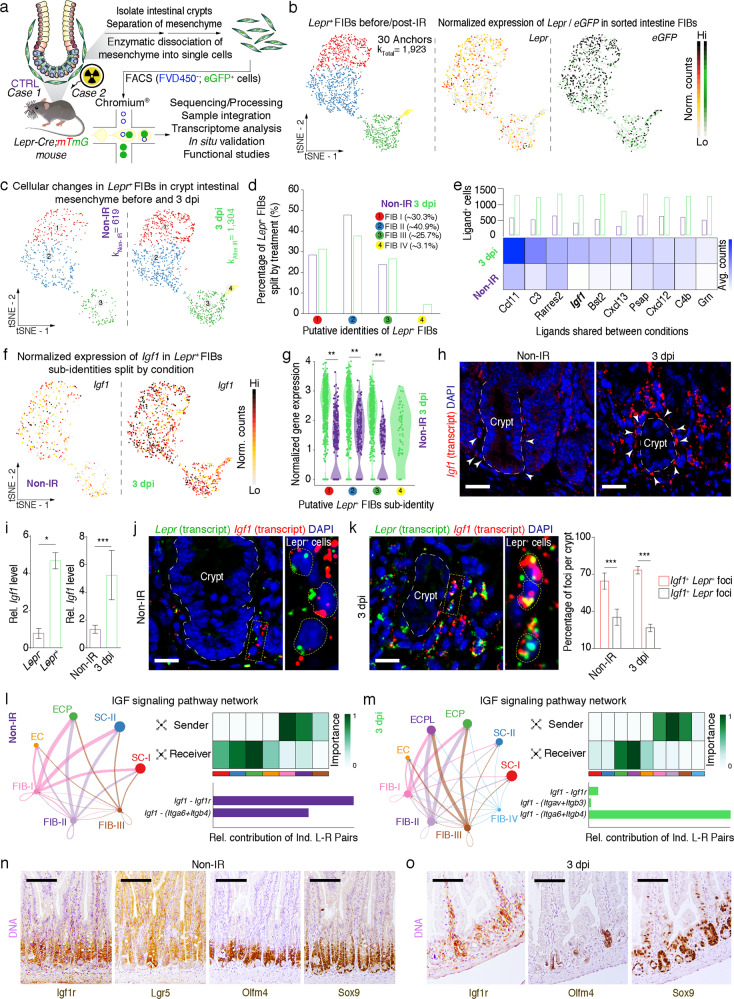
Fig. 4. scRNA-seq analysis identified Lepr+ cell-derived Igf1 as an important niche signal.
a Schematic diagram of Lepr+ MCs sorted from intestinal crypts of Lepr-Cre;mTmG mice before or 3 days post-irradiation, capture of single cells by droplet-based device, 3ʹ-scRNA-seq, and downstream query and comparative analyses. b Sub-cluster of anchored and integrated (n = 30 anchors each) Lepr+ fibroblasts (k = 1923 cells) visualized in t-SNE embedding. Feature plots of Lepr and eGFP expression based on normalized counts and visualized on t-SNE embedding. c Lepr+ fibroblasts split by condition (before IR, k = 619 viable cells; 3 dpi, k = 1304 viable cells). d Quantification of the percentage of Lepr+ fibroblasts per cluster split by condition. e Heatmap showing top 10 ligands expressed in Lepr+ fibroblasts before and 3 days post-irradiation and percentage of cells in each condition expressing such ligand at gene/features counts > 0. f Feature plots of Igf1 expression based on normalized counts and visualized on t-SNE embedding and split by condition. g Violin plot of Igf1 expression based on normalized counts in Lepr+ fibroblast clusters across conditions. **P < 0.01 (two-sided Wilcoxon rank-sum test). h In situ hybridization for Igf1 in jejunum of 8-week-old mice before and 3 days post-irradiation (n = 3). Scale bar, 25 μm. i qRT-PCR analysis for Igf1 in Lepr+ and Lepr– cells from Lepr-Cre;mTmG mice before or 3 days post-irradiation (n = 3). j, k In situ hybridization for Igf1 and Lepr in jejunum of 8-week-old mice before (j) or 3 days post-irradiation (k). The white dashed line represents the border between intestinal epithelium and mesenchyme in crypts. Insets on the right represent large magnification of yellow selected areas. Yellow dash lines in the insets indicate the border of individual cells. Graph showing quantification of the percentage of Lepr+Igf1+ and Lepr–Igf1+ cells in each crypt from WT mice (n = 3). Scale bar, 15 μm. l, m Circle plots showing inferred IGF signaling between Lepr+ fibroblasts (FIB1-IV) and Msi1+ intestinal epithelial cells before irradiation (l) and 3 days post irradiation (m) (cluster stem cells-I (SC-I)), cluster stem cells-II (SC-II), cluster EC precursors (ECP), cluster EC and cluster EC precursor-like cells (ECPL). Data of epithelial cells were adapted from our previous study.29 The size of the circle is proportional to the number of cells in each cell cluster and the edge connecting the circles represent the communication probability between any two cell groups. The color of the edge denotes directionality (i.e., senders vs receivers). The heatmap shows the relative importance of each cell group based on the computed network centrality for sender, receiver, mediator and influencer for IGF signaling pathway network. Graphs represent the quantification of the relative contributions of individual ligand–receptor pairs to the overall IGF communication network. n Immunohistochemistry for Igf1r, Lgr5-GFP, Olfm4 and Sox9 in serial sections of jejunum from Lgr5-eGFP-CreERT2 mice (n = 3). Scale bar, 100 μm. o Immunohistochemistry for Igf1r, Olfm4 and Sox9 in serial sections of jejunum from WT mice 3 days post-irradiation (n = 3). Scale bar, 100 μm. Values in the graphs represent means ± SD. Unpaired Student’s t-test was used for calculating P values in i and k. *P < 0.05; ***P < 0.001.

