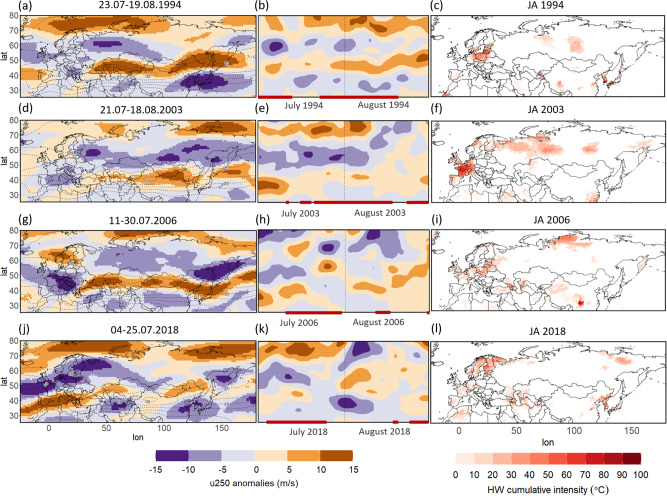
Fig. 4. Summers 1994, 2003, 2006, 2018: double jets and heatwave intensity.
a Anomalies of the 250hPa zonal wind (u250; shading, anomalies from climatology; dashed contour lines show the total wind speed climatology plotted every 5 m/s) for the longest double jet event in 1994: 23.07-19.08.1994. b Hovmöller diagram of the Eurasian (region seen in panel a) zonal mean zonal wind anomalies for July-August 1994 (shading; 5day running means centered on each day from 01.07-31.08.1994). The vertical dashed line refers to the first day of August and the red horizontal lines on the time axis show the days identified by the SOMs as double jets (dates for 1994: 1-12.07, 23.07-19.08). c Spatial distribution of heatwave cumulative intensity for July-August 1994. d As in a but for 21.07-18.08.2003. e As in b but for July-August 2003 (dates of all double jets for 2003: 11.07, 16-19.07, 21.07-18.08, 24-31.08). f As in c but for July-August 2003. g As in (a) but for 11-30.07.2006. h As in b but for July-August 2006 (dates of all double jets for 2006: 11-30.07, 12-16.08, 31.08). i As in c but for July-August 2006. j As in (a) but for 04-25.07.2018. k As in (b) but for July-August 2018 (dates of all double jets for 2018: 04-25.07, 19-20.08, 25-31.08). l As in c but for July-August 2018.

