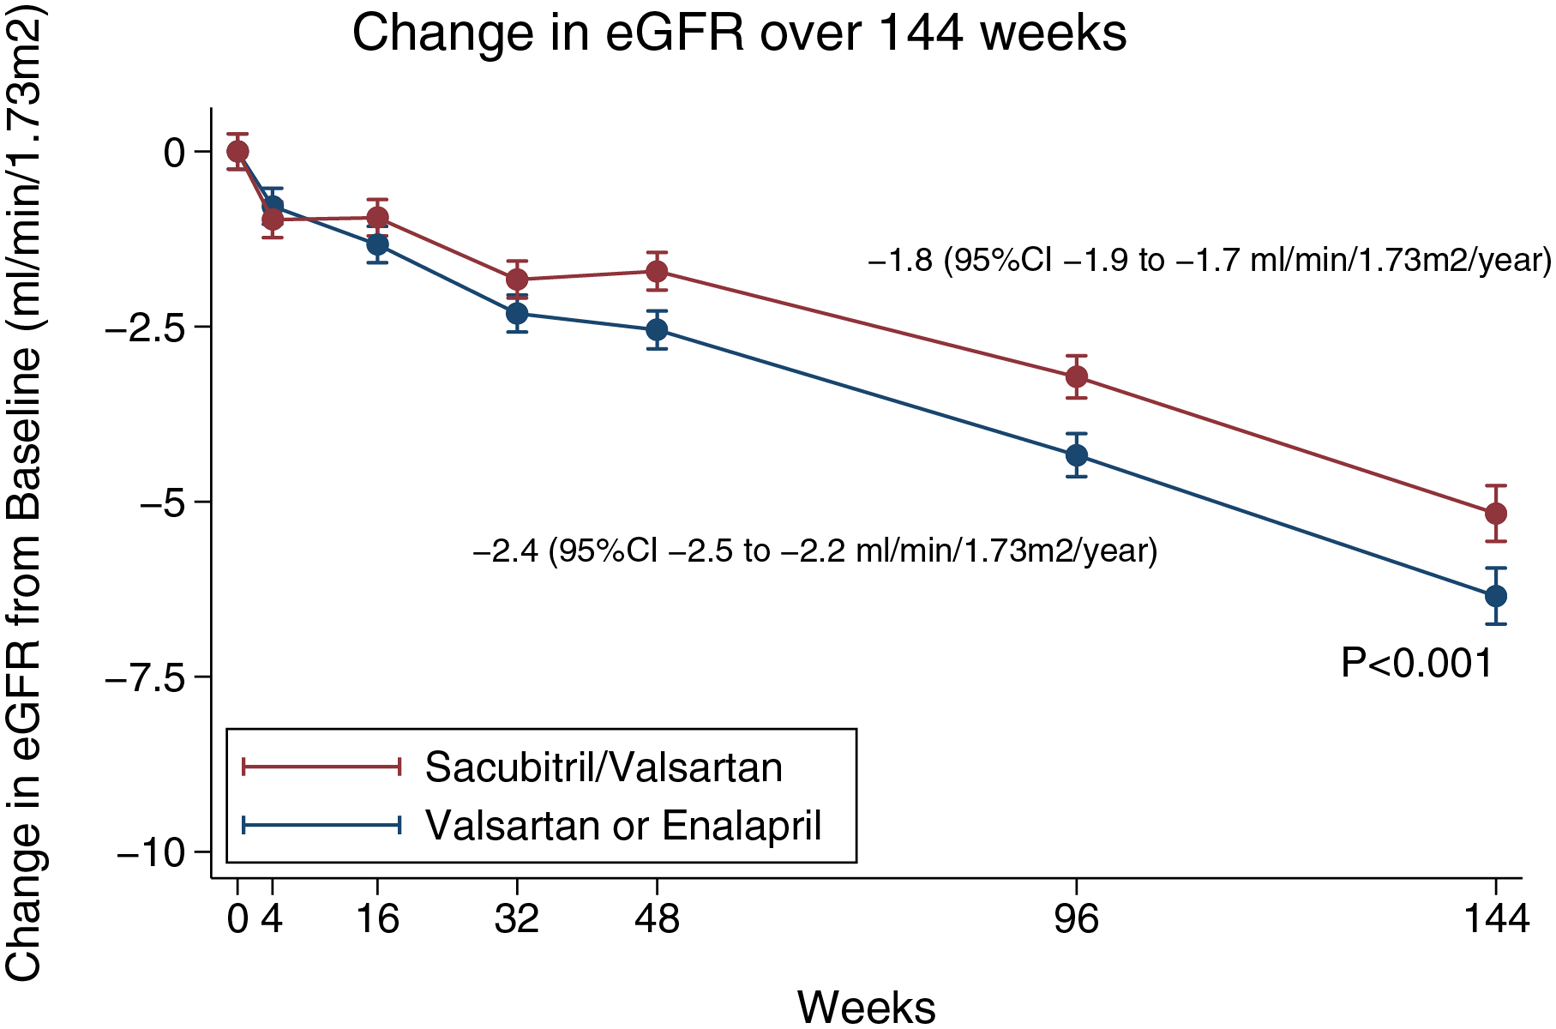
Figure 4. Change in renal function over time.

Shown are the adjusted means for the estimated glomerular filtration rate (eGFR) over a period of 144 weeks. The I bars indicate 95% confidence intervals. The eGFR was calculated according to the creatinine formula developed by the Chronic Kidney Disease Epidemiology Collaboration study. This panel is based on a mixed-model, repeated measures analysis in patients who had a baseline and post-baseline measurement.
