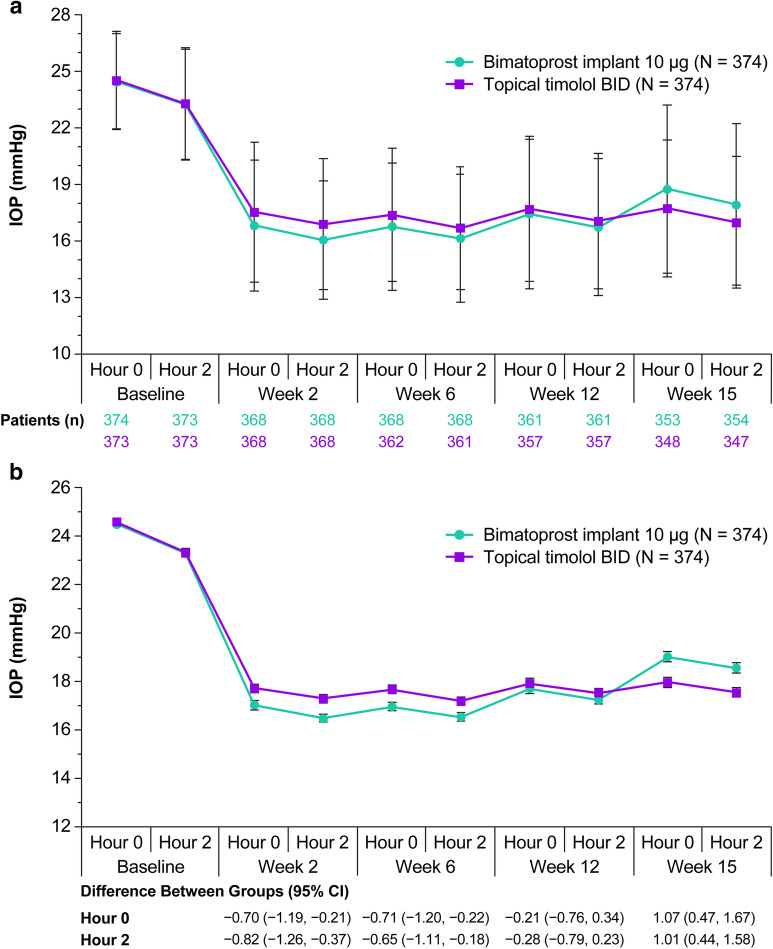
Fig. 1.
IOP in study eyes after a single administration of 10-µg bimatoprost implant or topical timolol maleate 0.5% BID through week 15 in the pooled ARTEMIS phase 3 studies. The analysis used observed values for eyes that had not received any rescue IOP-lowering treatment. a Mean ± SD IOP. b Postbaseline IOP was compared between groups at hours 0 and 2 at weeks 2, 6, 12, and 15 using a mixed-effects model for repeated measures. Least-squares estimates of mean ± SE IOP at postbaseline time points, the differences between groups (bimatoprost implant minus timolol), and the 95% CIs of the between-group differences were derived from the model. Baseline IOP is mean ± SE calculated in a separate analysis. BID twice daily, CI confidence interval, IOP intraocular pressure, SD standard deviation, SE standard error

