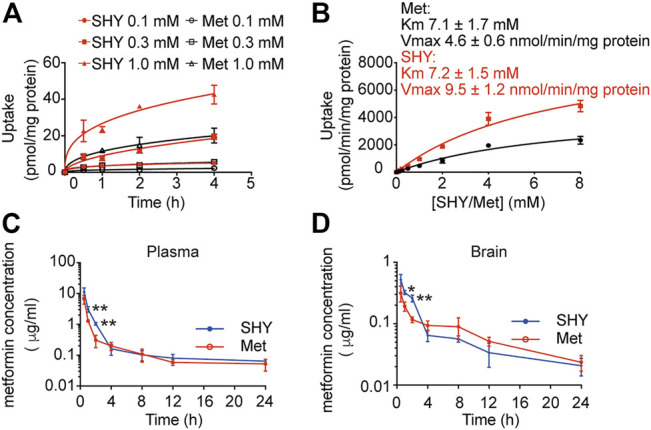
FIGURE 3.

Pharmacokinetic profiles of metformin in microglial cells in vitro and rats in vivo. (A) BV-2 microglial cells were incubated with different concentration of SHY-01 (SHY) or metformin hydrochloride (Met) for the indicated periods, supernatants were discarded and cells were lysed for intracellular metformin analysis by LC-MS. Data were expressed as mean ± SD (n = 3). (B) Uptake of metformin (15 min) into BV-2 microglia cells incubated with different concentrations of SHY-01 (SHY) or metformin hydrochloride (Met). The Michaelis-Menten equation with one saturable component was fit to the corrected uptake rate and the estimated Km and Vmax values are presented. (C) Plasma and brain concentration-time profile of metformin after intraperitoneal injection of SHY-01 in rats. SHY-01 (SHY, 50 mg/kg) or metformin hydrochloride (Met, 50 mg/kg) were administrated (i.p.) to rats. Blood samples were taken from fundus venous plexus at 0, 15, 30, and 60 min, 2, 4, 8, 12, and 24 h after injections. Concentrations of metformin in plasma was analyzed by LC-MS/MS. (D) Rats were sacrificed and brains were assessed at 0, 15, 30, and 60 min, 2, 4, 8, 12, and 24 h after injections. Concentrations of metformin in brain tissue were analyzed by LC-MS/MS. Results are expressed as mean ± SD (n = 3 rats/group). Two-tailed unpaired Students’ t-test was used to analyzing the difference between SHY- and Met-treated groups in each time point. ∗ p < 0.05, ∗∗ p < 0.01 versus the Met-treated group.
