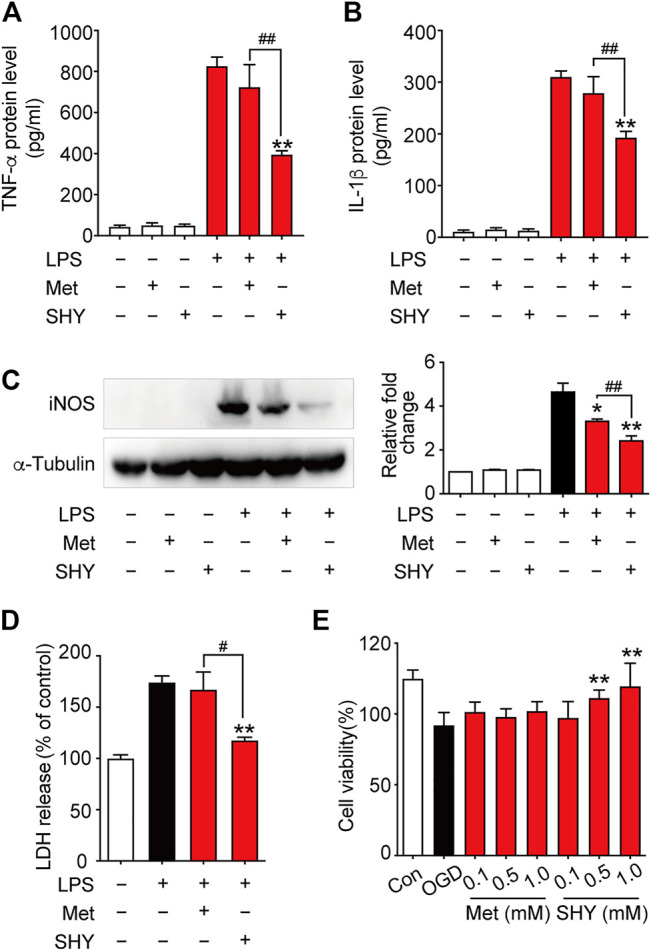
FIGURE 7.

SHY-01 protects against neuronal damage via suppression of microglia activation or direct neuroprotection. BV-2 microglial cells were pre-incubated with SHY-01 (SHY, 1 mM) or metformin hydrochloride (Met, 1 mM) for 1 h followed with LPS (200 ng/ml) treatment. Supernatants of microglia were collected after 24 h for (A) TNF-α and (B) IL-1β protein level measurement with ELISA. Data were presented as mean ± SD, statistical analysis was performed with one-way ANOVA followed by a Dunnett’s post hoc tests, ∗∗ p < 0.01 versus LPS group; ## p < 0.01, versus LPS with SHY-treated group. (C) BV-2 microglial cells were collected after 12 h of LPS treatment for iNOS protein level measurement with Immunoblotting. n = 3, data are presented as means ± SD, statistical analysis was performed with one-way ANOVA, followed by a Dunnett’s post hoc tests, ∗ p < 0.05, ∗∗ p < 0.01 versus LPS group; ## p < 0.01, versus LPS with SHY-treated group. (D) Rat primary microglia were treated with SHY (1 mM) or Met (1 mM) for 1 h, followed with LPS (200 ng/ml) incubation for 24 h. Conditioned medium was then collected to stimulate rat primary cortical neurons for another 24 h, supernatant was harvested for LDH analysis. Results are expressed as mean ± SD (n = 5). Data are presented as mean ± SD, statistical analysis was performed with one-way ANOVA, followed by a Dunnett’s post hoc tests, ∗∗ p < 0.01 versus LPS group; # p < 0.05, versus LPS with SHY-treated group. (E) Primary cortical neurons were pre-treated with SHY or Met at 0.1, 0.5, and 1.0 mM for 24 h. The cultures were then subjected to oxygen and glucose deprivation (OGD) for 3 h followed by reperfusion with normal culture medium for another 24 h. Cell viability was analyzed by MTT assay, results are expressed as mean ± SD (n = 8). Statistical analysis was performed with one-way ANOVA, followed by a Dunnett’s post hoc tests. ∗∗ p < 0.01 versus OGD group.
