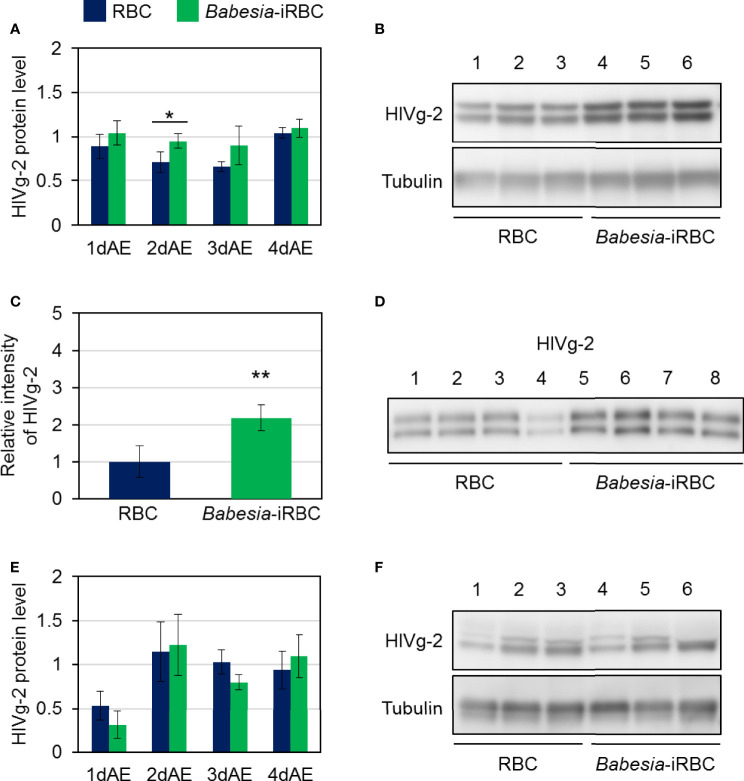
Figure 4.
HlVg-2 protein levels in (A, B) the fat body, (C, D) the hemolymph, and (E, F) the ovary after semiartificial mouse skin membrane feeding with bovine red blood cells (RBC group) or with Babesia-infected bovine red blood cells (Babesia-iRBC group). The protein was extracted from the fat body or ovary of engorged female ticks 1, 2, 3, and 4 days after engorgement (1dAE-4dAE) and from the hemolymph 2dAE. Western blotting was performed using an anti-HlVg-2 serum. Anti-H. longicornis tubulin serum was used as loading control for the fat body and ovary samples. Positive bands of HlVg-2 in (B) the fat body and in (F) the ovary 2dAE are shown in the upper panels while bands of tubulin are in the lower panels. Lanes 1–6 contain equal numbers of tick fat body and ovary (n = 3 per group). HlVg-2 protein levels (A, E) were calculated relative to the band intensities of tubulin signals in the same samples. (C, D) HlVg-2 in the hemolymph 2dAE was detected using western blotting. Relative intensities (C) of HlVg-2 in the Babesia-iRBC and in the RBC group were calculated on the basis of the intensities of positive bands (D). Lanes 1–8 contain equal numbers of tick hemolymph (n = 4 per group). Data represent the mean ± SD. Asterisks indicate the significant differences between the RBC and Babesia-iRBC groups (*P < 0.05, **P < 0.01 via Student’s t-test).

