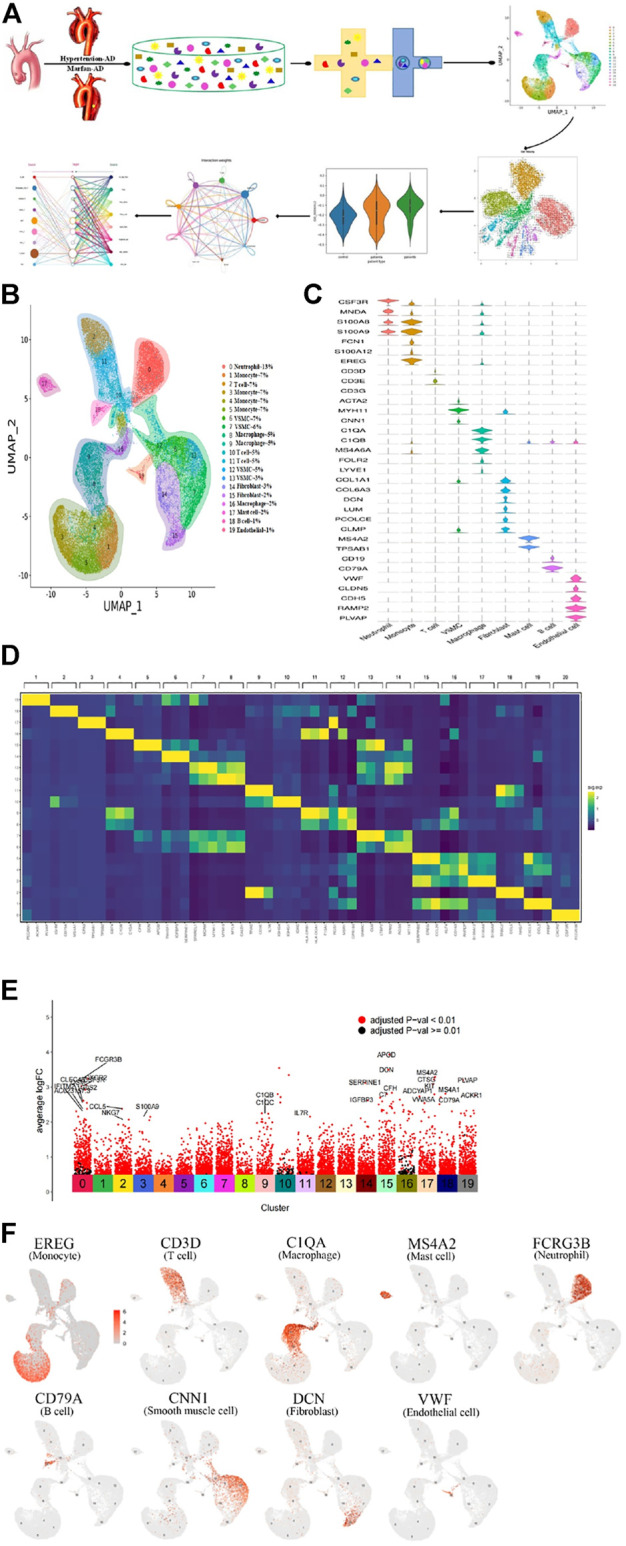
FIGURE 1.

Single-cell RNA sequencing analysis reveals cellular heterogeneity in hypertension and Marfan-induced aortic dissection (AD). (A) The schematic figure for tissue collection, cell digestion, procession, isolation, and capture by the BD device, and then data analysis. (B) 20 distinct clusters of cells were identified and color-coded and are exhibited in the UMAP plot, showing the cellular heterogeneity. Different cell identities and percentages were defined for each cluster shown on the right. (C) The marker genes of different cell types are shown in the violin plot. (D) The top three genes and relative expression levels of each cluster are shown in the heatmap. (E) The significant upregulation genes in each cluster. (F) UMAP plots of expression distribution for selected cluster-specific marker genes. Mo, monocyte; Mac, macrophage; Neu, neutrophil; SMC, smooth muscle cell; Fib, fibroblast; EC, endothelial cell.
