
FIGURE 3.
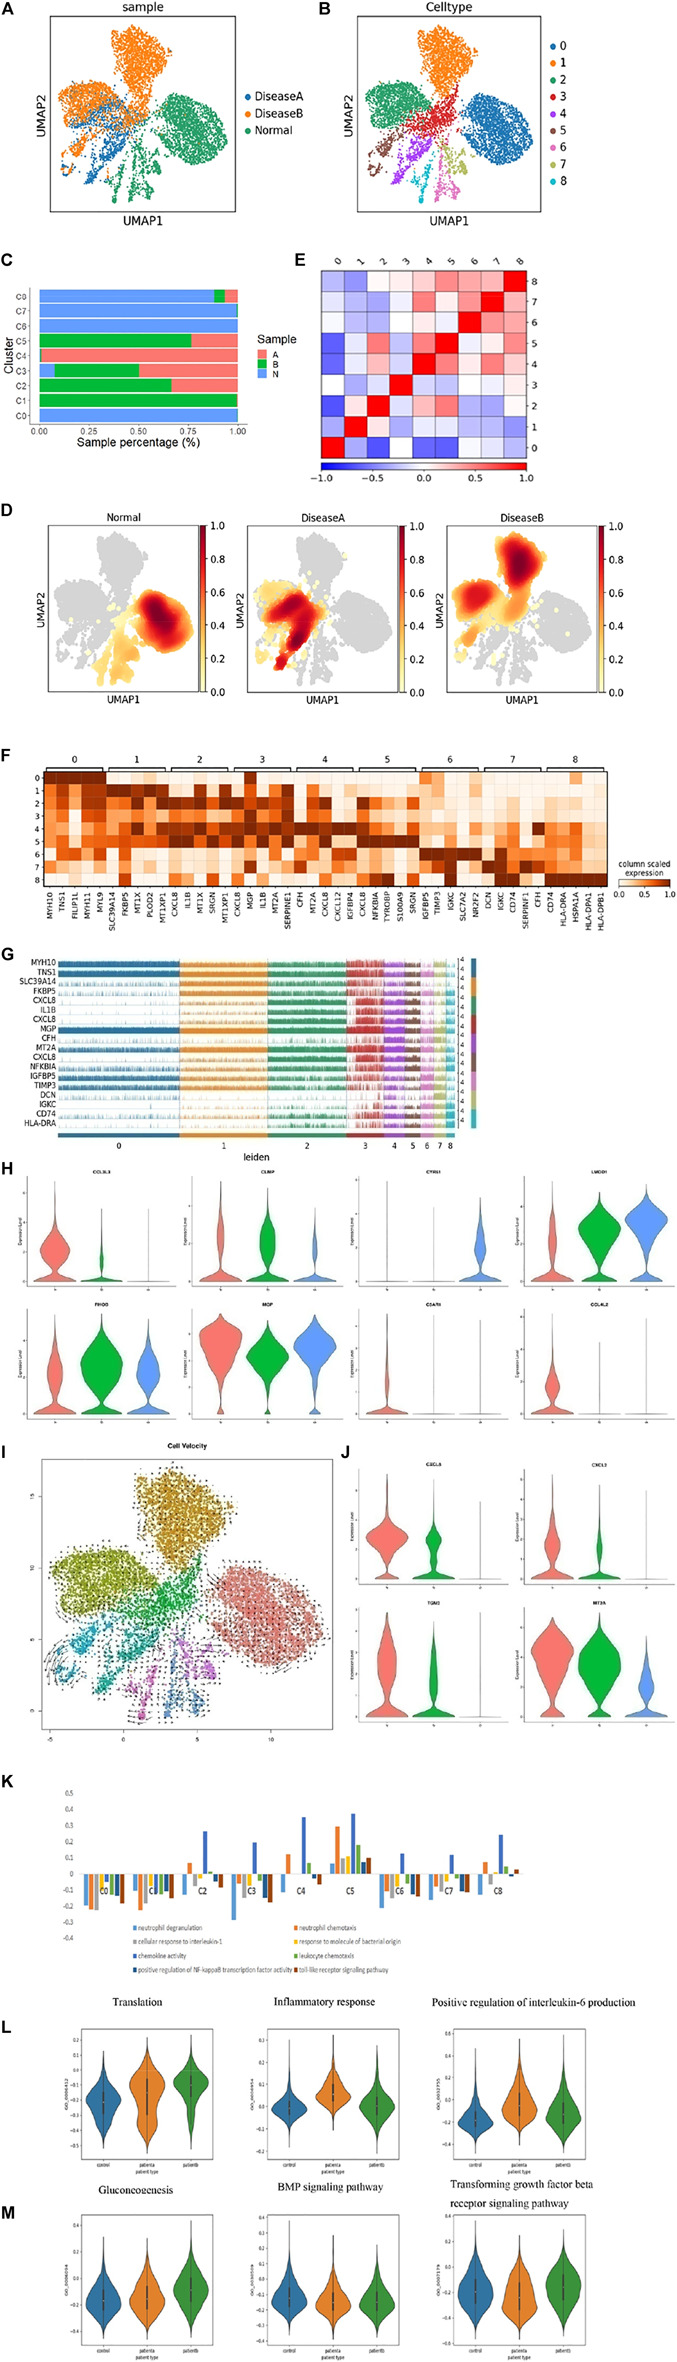
Heterogeneity of smooth muscle cells in human ascending thoracic aortic walls. (A) UMAP plot showing SMCs of different samples by Seurat and Harmony analysis. (B) SMCs were further divided into nine subclusters (C0∼8) shown in the color-coded UMAP plot. (C) The proportion of each cluster of cells in different samples. (D) Nuclear density figure showing the different spatial distribution of SMCs, the degree of red indicates the density of the cells. (E) Correlation analysis of SMC subclusters. (F) Heatmap showing the top five genes and their relative expression in each subcluster of SMCs. (G) The expression distribution of hypervariable genes in each cell. (H) The violin diagram shows some special changed genes in SMCs of diseases. (I) RNA velocity analysis showed the possible transition between different cluster cells. The arrow shows the direction of the transformation. (J) The violin diagram showing some special changed genes in subcluster SMCs of diseases. (K) Differences in pathway activities scored per SMCs by GSVA with different subclusters. (L,M) Differences in pathway activities scored per SMCs by GSVA among disease a and normal (L), disease b and normal (M). A: disease a, B: disease b, N: normal.