Fig. 1.
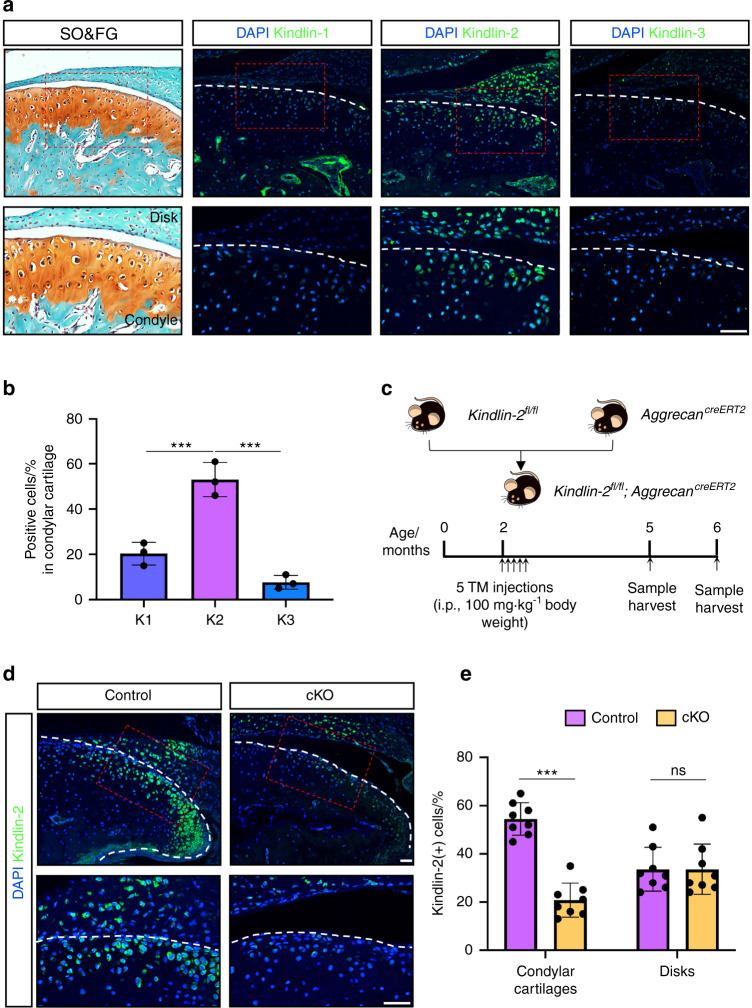
The high protein expression level of Kindlin-2 in mandibular condylar chondrocytes in mice. a Representative images of safranin O & fast green (SO&FG, left panel) and immunofluorescent (IF, right panels) staining of mouse TMJ sections. Higher-magnification images (red dashed boxes) are shown in lower panels. Scale bar: 50 μm. b Quantification of Kindlin-1-, 2-, and -3-positive cells in condylar cartilage. N = 3 mice per group. ***P < 0.001. c A schematic diagram illustrating the experimental design. d IF staining for Kindlin-2 expression in control or cKO TMJs at 3 months post TM injections. Scale bar: 50 μm. e Percentages of Kindlin-2-expressing cells in mandibular condylar cartilage and articular disc, respectively. Results are expressed as mean ± standard deviation (s.d.). n = 8 mice per group. ***P < 0.001; ns not significant, TM tamoxifen

