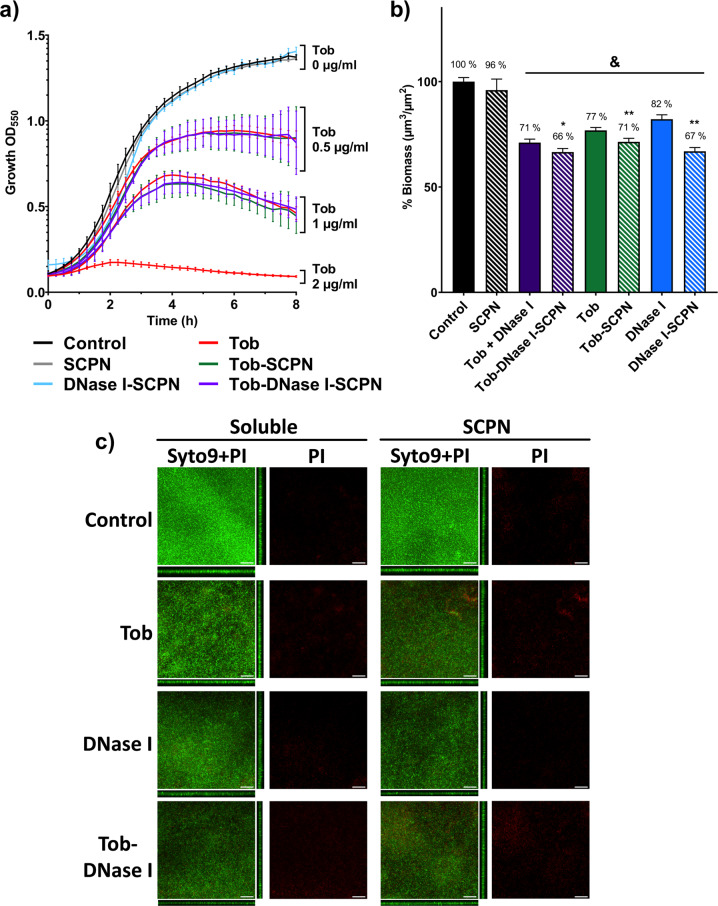
Fig. 2. P. aeruginosa planktonic and biofilm treatments with different SCPNs.
a Eight-hour bacterial growth curves for P. aeruginosa treated with soluble tobramycin (Tob, red) and different nanoparticles containing 0 µg/ml Tob (gray, 50 µg/ml SCPN; blue, 50 µg/ml DNase I-SCPN), 0.5 µg/ml Tob (green, 1.25 µg/ml Tob-SCPN; purple, 2.2 µg/ml Tob-DNase I-SCPN) and 1 µg/ml Tob (green, 2.5 µg/ml Tob-SCPN; purple, 4.3 µg/ml Tob-DNase I-SCPN). Black lines (control) represent growth without any treatment. Error bars indicate the standard deviation between three experiments with three replicates of each experiment. b Degradation of 72 h-old biofilms of P. aeruginosa treated for 16 h with 0.26 µg/ml DNase I and/or 2 µg/ml tobramycin (solid bars) and with nanoformulation containing SCPN with the corresponding concentration of both actives (striped bars). Blue, green and purple bars correspond to DNase I treatment, antibiotic tobramycin, and both treatments together, respectively. Data for the control (nontreated biofilm) and SCPN (without tobramycin and DNase I) are shown in black bars. All values are normalized against the control sample. Error bars indicate the standard deviation between two experiments with at least three replicates of each experiment. Statistical analyses were performed with the Student Unpaired t test (&p < 0.005 vs. Control, *p < 0.05; **p < 0.005 vs. treatment without SCPN) to determine significance. c Confocal laser scanning microscopy images of Live/Dead-stained P. aeruginosa biofilms. In each condition, it is shown the sum of the stack and the corresponding orthogonal views of merged live (Syto9) and dead (PI) staining and only the dead (PI) staining. The scale bar represents 40 µm.

