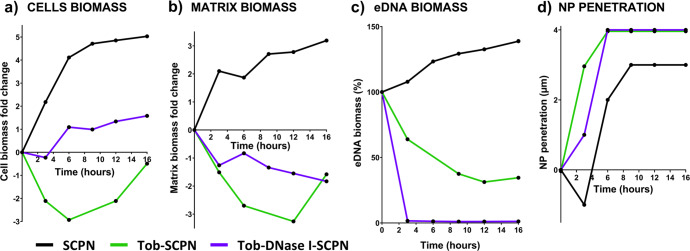
Fig. 4. Biofilm behavior components with time.
Representative experiments on biomass variation over time in (a) cells, (b) matrix, and (c) extracellular DNA (eDNA) in a biofilm treated with SCPN (without tobramycin and DNase I) (black line), Tob-SCPN (green line), and Tob-DNase I-SCPN (purple line). The biomass variations in (a, b) are represented as fold changes, while the variations in (c) are described as percentages. d Positions of nanoparticle aggregates in the biofilm matrix. The results presented in this figure are representative of an experiment repeated at least twice with similar results.

