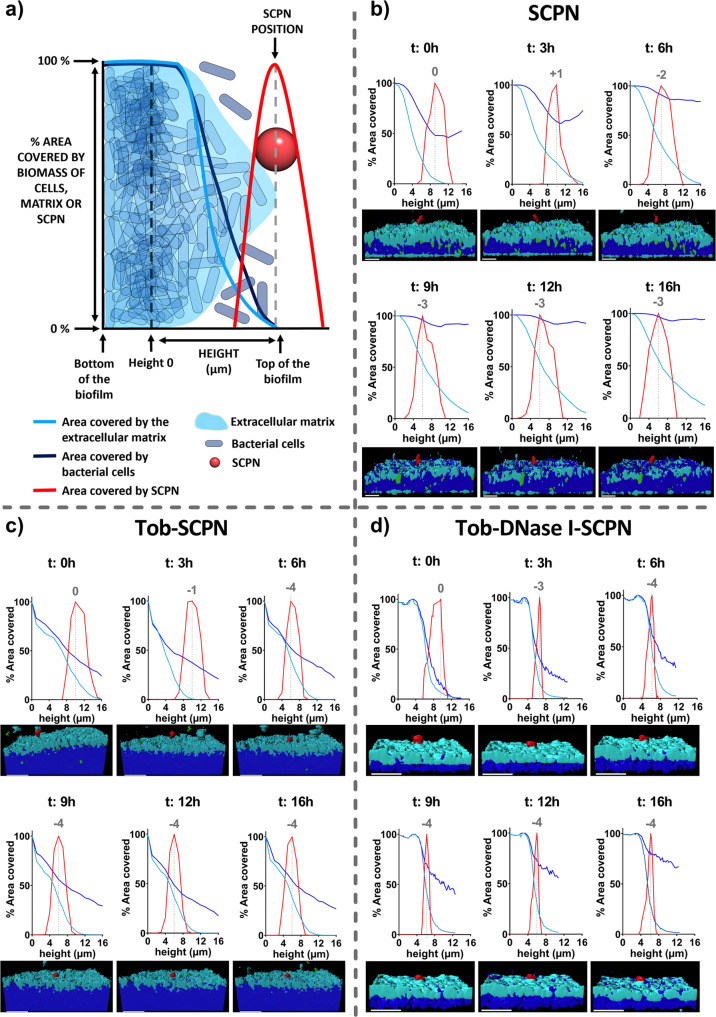
Fig. 5. Tracking of an SCPN aggregate into the P. aeruginosa biofilm for 16 h.
a Schematic representation of the graphs. b SCPN (without tobramycin and DNase I), (c) tobramycin-containing nanoparticles and (d) nanoparticles encapsulating both tobramycin and DNase I. Lines represent the area percentages occupied in layers by the cells (dark blue line), matrix (light blue line), and nanoparticles (red line) at different times. The height of 0 on the x-axis is taken as the moment when the biofilm started to decrease. The area values covered in the nanoparticle were normalized by assigning 100% at the highest percentage. Gray numbers represent movement (in µm) of the nanoparticle in the biofilm. A 3D representation view of the biofilm is illustrated for each time. The scale bar represents 10 µm. The results presented in this figure are representative microscopy images of an experiment repeated at least twice with similar results.

