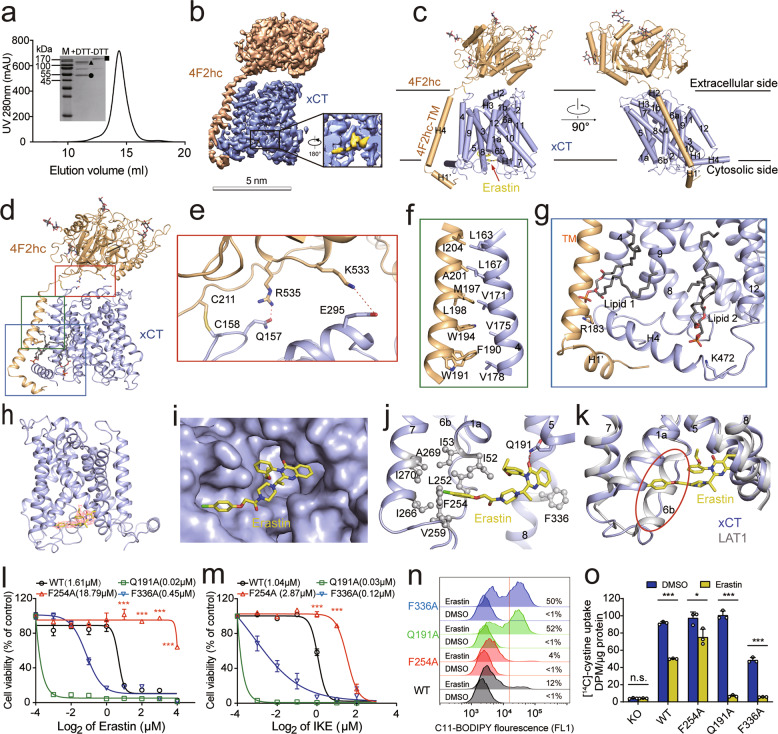
Fig. 1. Cryo-EM structure of the erastin-bound xCT–4F2hc complex and the inhibitory effect of erastin on xCT activity in ferroptosis.
a Representative gel filtration purification of the xCT–4F2hc complex. The inset shows a Coomassie blue-stained SDS-PAGE gel under reducing (+DTT) and oxidizing (–DTT) conditions. M, molecular weight marker. The bands corresponding to 4F2hc, xCT, and the disulfide-linked xCT–4F2hc complex are labeled with a triangle, circle, and square, respectively. b, c Cryo-EM map (b) and atomic model (c) of the erastin-bound xCT–4F2hc complex. d Interaction interfaces between xCT and 4F2hc. The boxed regions (from top to bottom) are shown in e, f and g. e Detailed view of the interactions at the extracellular interface, with the polar interactions shown as red dashed lines. f Detailed view of the hydrophobic interactions between the transmembrane helix in 4F2hc and TM4 in xCT. g Detailed view of the xCT–4F2hc complex at the intracellular side; xCT is bound to two lipid molecules. h Structure of the erastin-bound xCT subunit, with the density for erastin shown in mesh. i Model of the erastin-binding pocket located in the intracellular vestibule of xCT. j The erastin molecule is shown sandwiched between TM domains in xCT; the tail of the erastin molecule is surrounded by a cluster of hydrophobic residues (shown as spheres). k Overlay showing the structure of the TM domains in erastin-bound xCT and erastin-bound LAT1 (PDB ID: 6IRT). l, m Dose-response curves for erastin (l) and IKE (m) measured in xCT-knockout HT-1080 cells expressing either WT xCT or the indicated xCT mutants; the corresponding IC50 values are also shown. n Erastin-induced lipid peroxidation was measured using C11-BODIPY in xCT-knockout HT-1080 cells expressing either WT xCT or the indicated xCT mutants, 12 h after treatment with 2 μM erastin or DMSO as a negative control. The corresponding percentage of C11-BODIPY-positive values are shown. o Na+-independent [14C]-cystine uptake was measured in xCT-knockout HT-1080 cells and in cells expressing either WT xCT or the indicated xCT mutants; where indicated, the cells were pretreated for 2 h with either 4 μM erastin or DMSO. In l, m ***P < 0.001 vs WT (one-way ANOVA); in o, *P < 0.05, ***P < 0.001, and n.s., not significant (P > 0.05) (Student’s t-test).

