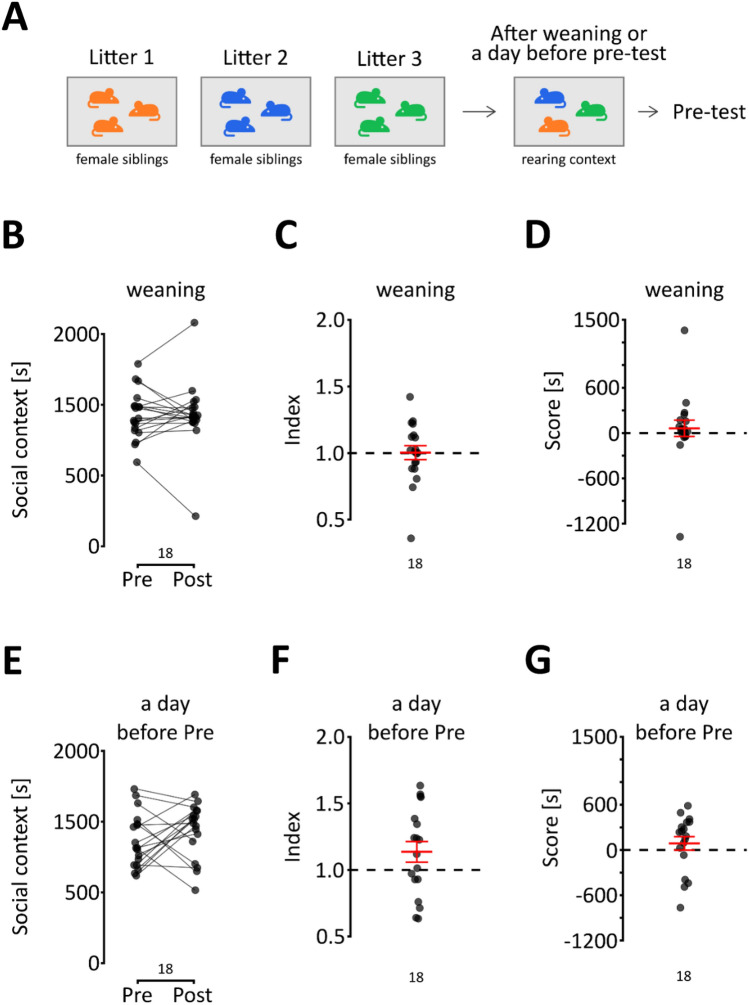
Figure 4.
The effect of familiarity on social reward. (A–C) The change in time spent in the first context between pre- and post-test, the index and the score, respectively, in female mice that were brought together right after weaning. The mean and s.e.m. values are shown in red. (D–F) These graphs are the equivalents for female mice that were brought together one day before the pre-test. The mean and s.e.m. values are shown in red.

