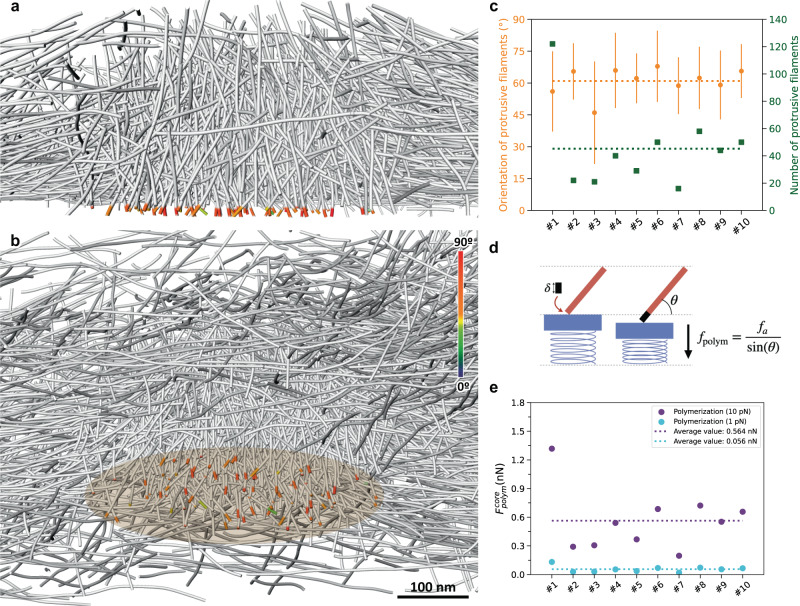
Fig. 2. The sum of the actin polymerization forces at the core membrane is below 1 nN.
a, b Perspective view (a) of a cross-section through podosome #8 displaying in color the part of the core filaments pushing against the plasma membrane, and orthographic view (b) of the same podosome from a different angle. The color map corresponds to the filament segment orientation with respect to the basal membrane. See also Supplementary Movie 5. The core diameter is approximately 400 nm. The original tomogram has been deposited in the EMDB under accession code EMD-13669. c Mean orientation (orange) and number (green) of polymerizing filaments at the core membrane. Data are presented as mean values +/– SD. At least 16 filaments were measured by tomogram. d Scheme representing the polymerization force fpolym generated by the addition of a new monomer at the growing end of a filament with an inclination θ relative to the membrane. e Estimated polymerization force generated at the core membrane (“Polymerization”) using the lower (“1 pN”; cyan filled circles) and upper (“10 pN”; purple filled circles) limit of the stall force, and respective average values (dotted lines of the same color). Source data are provided as Source Data files.

