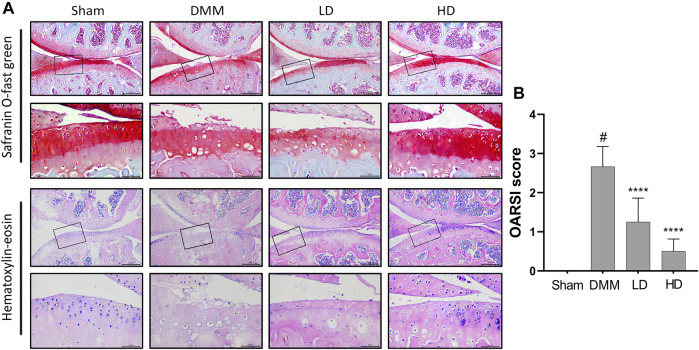
FIGURE 5.
Effect of CEP on cartilage degradation in DMM-induced OA pathogenesis. (A) Representative images of safranin O staining and H&E staining of knee joints in four groups (n = 6 per group). Scale bar = 200 µm. The framed area in each picture is shown below at a higher magnification. (B) Quantitation of OA severity by the OARSI score for mice in Figure 5A. LD and HD represent the dose of 5 and 15 mg/kg CEP, respectively. Values are expressed as mean ± SD, n = 6. #p < 0.05 vs. sham group, and ****p < 0.001 vs. OA group.

