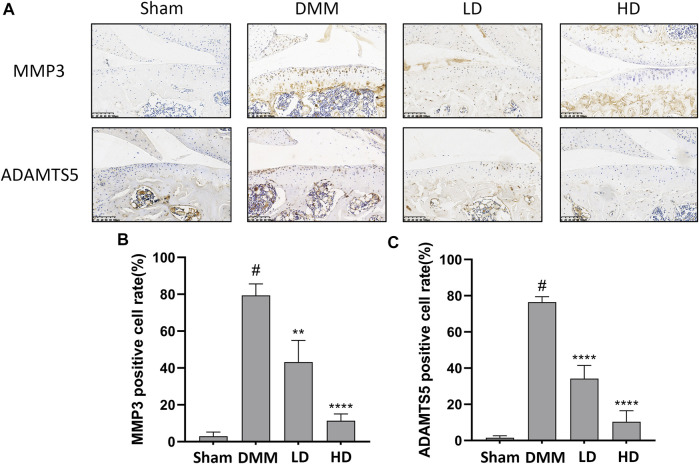
FIGURE 7.
CEP ameliorated cartilage inflammation in vivo. Immunohistochemistry (A) and quantitative analysis (B,C) for antibody against MMP3 and ADAMTS5. Scale bar = 100 μm. LD and HD represent the dose of 5 and 15 mg/kg CEP, respectively. Values are expressed as mean ± SD, n = 6. #p < 0.05 vs. sham group, **p < 0.01, and ****p < 0.0001 vs. OA group.

