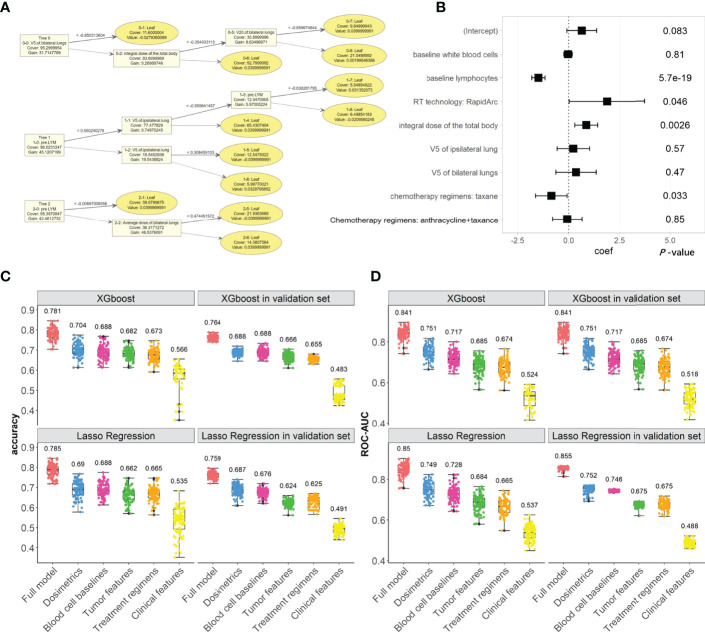
Figure 2.
The XGboost and Lasso regression models for predicting the radiation-induced lymphopenia were trained in Testing cohort and validated in Validation cohort. (A) The top two trees in one example of XGboost model; (B) coefficients and P-values in one example of Lasso regression; (C, D) the classifying performances (accuracy and ROC-AUC, respectively) of XGboost models across all iterations in Testing cohort and in Validation cohort, compared with the Lasso regressions. In subplots (C, D), numerical labels are median values. The color represents the feature’s group, including: the full model (Orange), dosimetrics (blue), blood cell baselines (maroon), tumor features (green), Treatment regimens (Khaki), clinical features (yellow).

