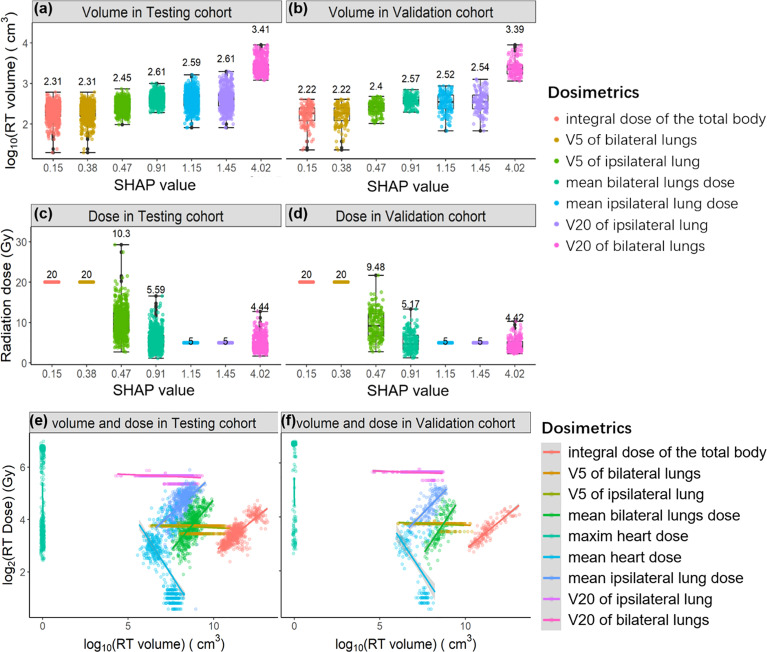
Figure 4.
The relationships between SHAP value and irradiation volume in the Testing cohort (A) and in the Validation cohort (B); the relationships between SHAP value and irradiation dose in the Testing cohort (C) and in the Validation cohort (D). The regression relationships between irradiation volume and irradiation dose in the Testing cohort (E) and in the Validation cohort (F). Each radiation dose is differently colored and sorted by SHAP value.

