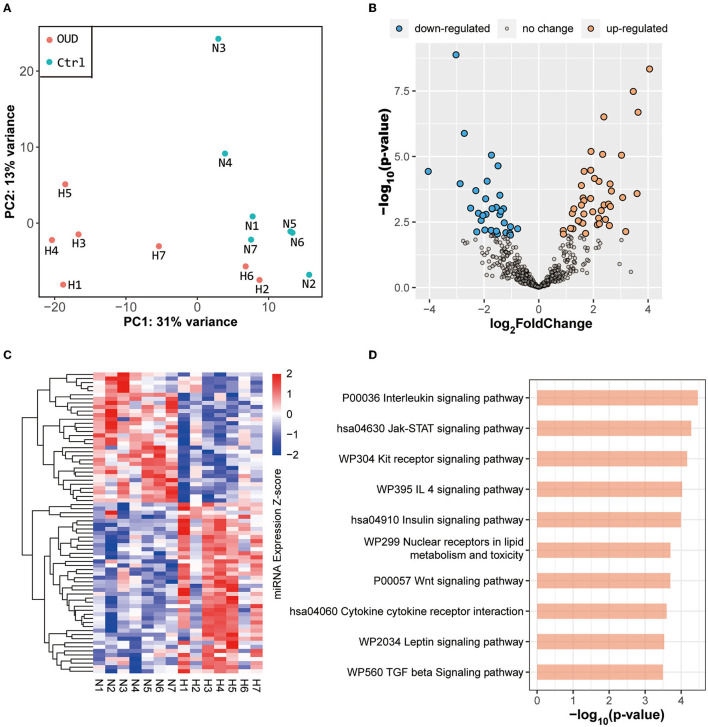
Figure 2.
Results of small RNA sequencing. (A) Principal component analysis results of all samples. The red dot in the figure represented the OUD group and blue dot represented the control group. (B) Volcano plot of all expressed miRNAs. We set the threshold of differential expression as |log2FoldChange| > 1.5 & p-value < 0.01. The blue dot, orange dot and gray dot represented the down-regulated miRNAs (OUD/Control), up-regulated miRNAs and non-significant changed miRNAs, respectively. (C) Expression heatmap of all differentially expressed miRNAs. (D) KEGG enrichment result of targeted genes predicted by differentially expressed miRNAs.

