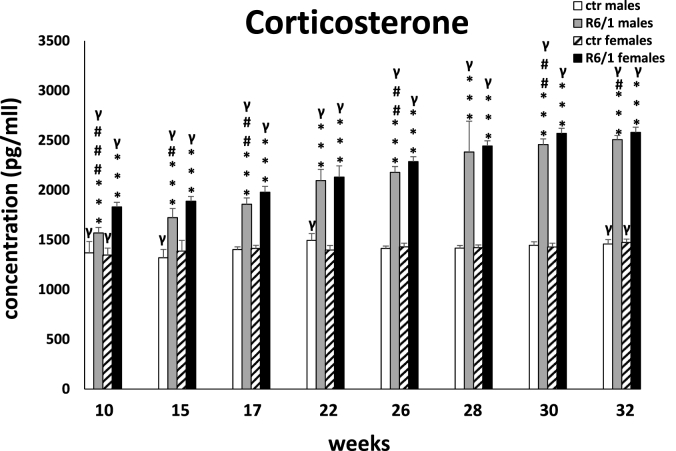
Fig. 2F.
Results on peripheral blood plasma corticosterone concentrations. Results are shown as mean values ± SD. The following statistical symbols were used to denote comparison with: ***p ≤ 0.001, **p ≤ 0.01, *p ≤ 0.05 - significance of differences in relation to an appropriate control group; ###p ≤ 0.001, ##p ≤ 0.01, #p ≤ 0.05 - comparison of males and females within a group; γp≤0.05 - symbol indicating differences between time points, without taking into account all levels of significance. Full statistics is presented in Supplementary tables. The number of animals in each group was 10.

