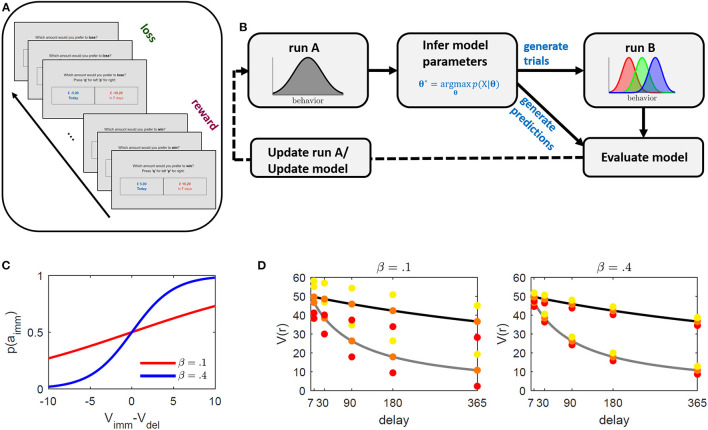
Figure 1.
Illustration of the intertemporal choice task (ICT) and proposed paradigm adaptation framework. (A) Schematic illustration of the ICT. Subjects were faced with a series of binary choice trials between an immediate and a delayed outcome. The absolute value of the delayed outcome was always higher. Reward and loss trials were presented within alternating blocks of 40 trials each. (B) Paradigm development framework. Subjects perform an ICT with equal trials across subjects (run A). The task is used to infer subject-level parameters based on a proposed underlying behavioral model. These parameters are used to generate individualized trials designed to elicit relative immediate choice frequencies of 0.3, 0.5, and 0.7 of run B (schematically displayed as red, green, and blue, respectively), and to generate behavioral predictions along with other common discounting models. By comparing observed and predicted behavior in run B, the task underlying model is either updated, or trials of run A are optimized to improve parameter inference. The procedure may be repeated until no further improvement is observed. (C, D) Illustration of method's operating principle. (C) Immediate choice probability p(aimm) (cf. Equation 2) as a function of the difference between immediate (Vimm) and delayed (Vdel) value for β = 0.1 (red), and β = 0.4 (blue). The indifference point where Vimm = Vdel is at 0. If Vimm > / < Vdel, immediate choice probability is below/above 0.5. β regulates the steepness of the curve and thus the sensitivity toward differences in values. Lower β values require larger value differences (x-axis) to obtain a comparable probability (y-axis). (D) Discounted value (y-axis) for different delays (x-axis) for two hypothetical discount parameter values (κ = 0.05 in gray and κ = 0.005 in black). The colored dots represent the method's selected immediate rewards ( = Vimm) at a given delay for the different induced immediate choice probabilities 0.3 (red), 0.5 (orange), and 0.7 (yellow). The distances between immediate values (colored dots) and delayed values (discounting curve) is constant across all delays to ensure equally induced probabilities across delays (see graph (C)). This also indicates that for subjects with different κ's, the reward and value ratios will vary. The left graph depicts selected rewards for a hypothetical β = 0.1 and the right graph for β = 0.4. While β regulates discounted value of the delayed reward Vdel, κ regulates the distance of the selected immediate reward around Vdel with higher β resulting in smaller differences, making the differentiation between the two more difficult (that is, requiring higher sensitivity).

