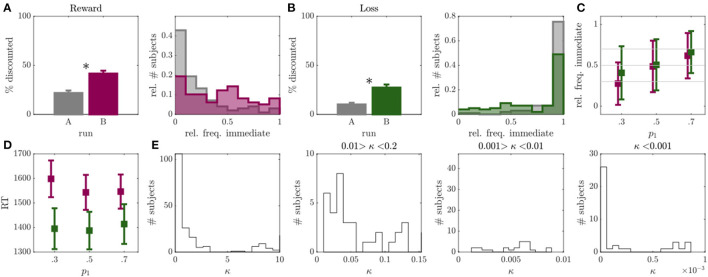
Figure 2.
Results of experiment 1. (A) Left: Percentage of discounted choices in run A (gray) and run B (magenta) for reward condition. Right: Histograms over relative frequency of immediate choices in run A (gray) and run B (magenta) for reward condition. Asterisks indicate significant differences. (B) Same as A for loss condition with run B displayed in green. (C) Mean and standard deviation of observed relative frequency of immediate choices for the experimentally evoked probabilities p1 = {0.3, 0.5, 0.7} (x-axis) in run B (individuals with >95% or <5% immediate choices were removed, N = 28 or 29% in reward, N = 52 or 53% in loss condition). (D) Mean and standard deviation of median reaction time (RT; y-axis) for p1 = {0.3, 0.5, 0.7.} trials (x-axis) in run B for reward (magenta) and loss (green) conditions. (E) Histograms over discounting parameter κ of the hyperboloid model for both loss and reward conditions, displayed at different resolutions and bin widths.

