Figure 3.
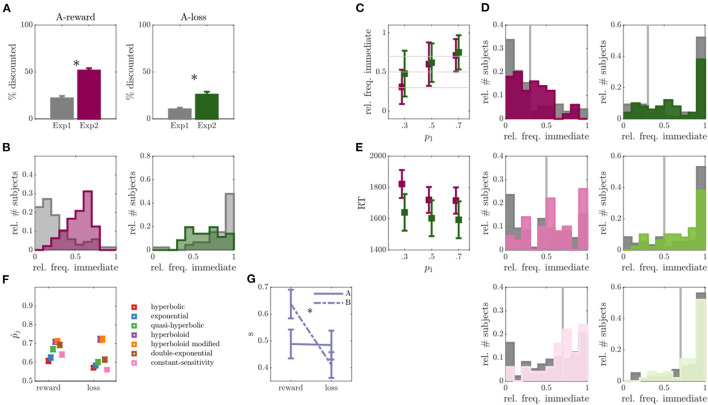
Results of experiment 2. (A) Percentage of discounted choices in run A for experiment (exp) 1 and exp 2 for reward (left) and loss (right) discounting. Asterisks indicate significant differences. (B) Empirical distribution of the relative frequency of immediate choices for reward (left) and loss (right) conditions in run A of exp 1 (gray) and exp 2 (colors). (C) Relative frequency of immediate choices (y-axis) in run B of exp 2 as a function of experimentally manipulated probabilities (x-axis) for reward (magenta) and loss (green) conditions (individuals without behavioral variability were removed, N = 2 for reward, N = 14 for loss condition). (D) Empirical distributions of the relative frequency of immediate choices in run B for trials with immediate choice probability 0.3 (top), 0.5 (middle) and 0.7 (bottom), as also indicated by the gray line. Reward condition is displayed left, loss right, exp 1 in gray and exp 2 in color. (E) Average over median reaction times (RT) for the three experimentally manipulated immediate choice probabilities for reward (magenta) and loss (green) conditions. (F) Average predicted (out-of-sample) probability of observed responses (y-axis) for reward and loss conditions (x-axis) for different models. (G) Inferred scaling parameters s of the modified hyperboloid model for reward and loss discounting conditions.

