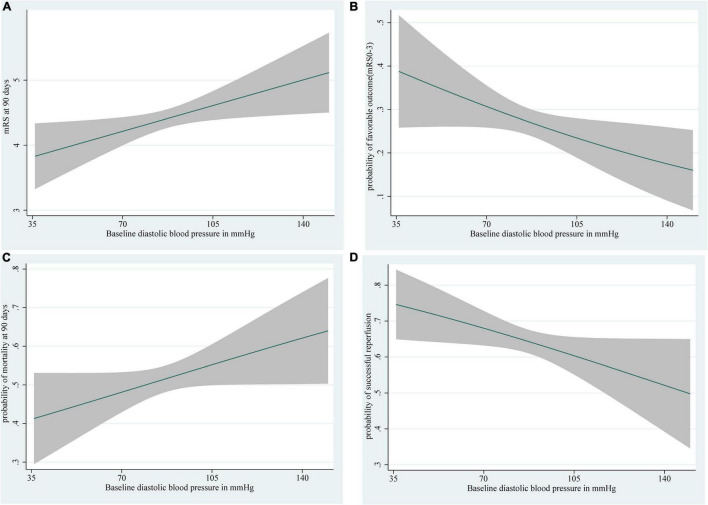
FIGURE 3.
Depiction of (A) the mRS score at 90 days, (B) the probability of a favorable outcome (mRS score 0–3), (C) the probability of 90-day mortality, and (D) the probability of successful reperfusion with 95% confidence intervals for each level of baseline DBP. The ranges of the x-axes correspond to the minimum and maximum systolic blood pressure values in this study (DBP: 36–150 mm Hg). Curves show the increases in (A) mRS score at 90 days, (C) an increased probability of 90-day mortality, (B) a decrease in predicted favorable outcome probabilities, and (D) a decreased probability of successful reperfusion with increases in DBP. DBP, diastolic blood pressure.

