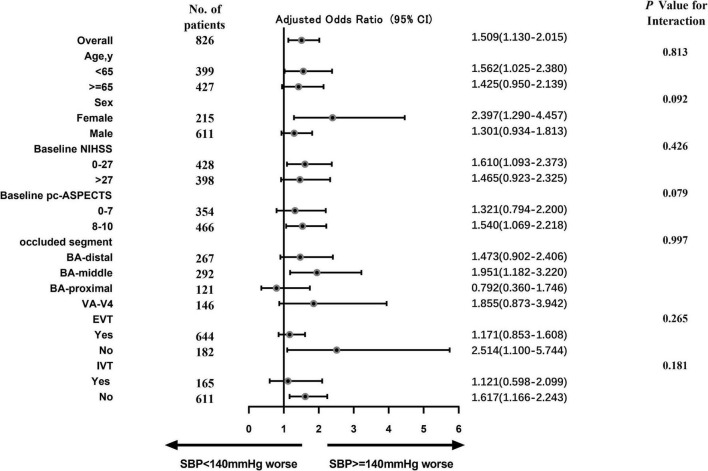
FIGURE 5.
This forest plot shows that the difference in the primary outcome (common odds ratio indicating the odds of deterioration of 1 point on the mRS at 90 days, analyzed with ordinal regression) between two SBP groups (SBP ≥ 140 mm Hg vs. SBP < 140 mm Hg) across all prespecified subgroups. The following variables are considered: hypertension, hyperlipidemia, atrial fibrillation, serum glucose, and stroke causative mechanism. The thresholds for baseline NHISS, baseline pc-ASPECTS, and age were chosen at the median. BA, basilar artery; EVT, endovascular therapy; and IVT, intravenous thrombolysis.

