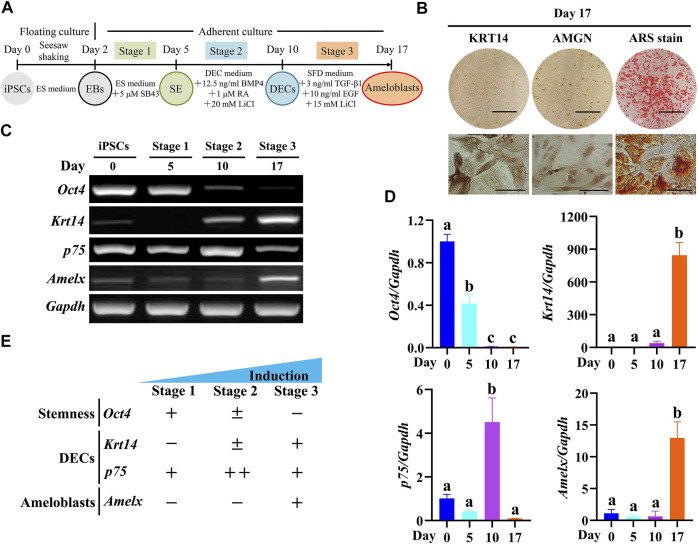
FIGURE 2.
Induced ameloblast lineages from Epfn-iPSCs following a three-stage induction protocol. (A) Diagram of the three-stage ameloblast induction protocol. (B) Stain of keratin 14 (KRT14), amelogenin (AMGN), and Alizarin Red S (ARS) on day 17 after ameloblast induction. Scale bars: 1 cm and 100 μm for upper and lower panels, respectively. (C,D) Stage-specific marker gene expression during the stepwise ameloblast induction of Epfn-iPSCs by RT-PCR (C) and real-time PCR (D). Different letters among groups (e.g., A,B) in Figure D indicate significant differences (p < 0.05; one-way ANOVA and Tukey’s test; n = 3). (E) Summary of gene expression in Figure C and D.

