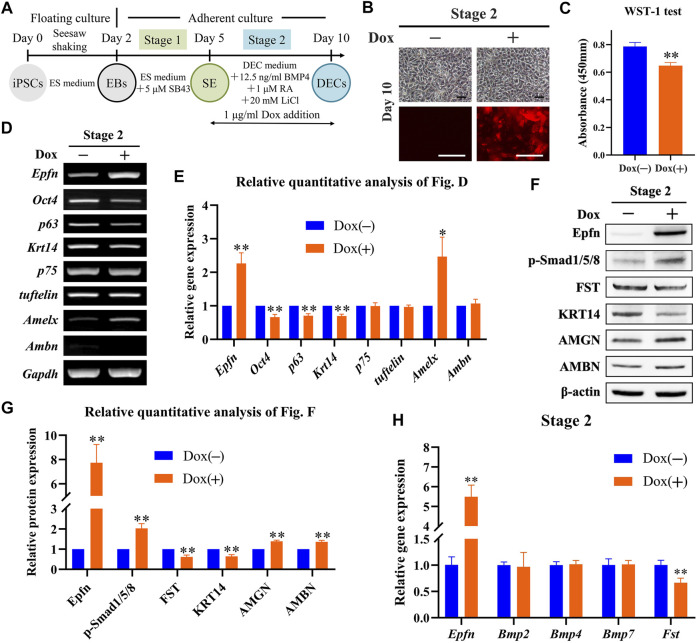
FIGURE 3.
Role of Epfn activation at stage 2 in DEC induction. (A) Diagram of DEC induction from Epfn-iPSCs. Dox (1 μg/ml) was added at stage 2 to activate Epfn expression. (B) Cell morphology (upper) and mCherry expression (lower) on day 10. Note: the reporter gene mCherry was mainly located around the nucleus, with partial distribution in the cytoplasm. Scale bar: 100 μm. (C) WST-1 test on day 10. **, p < 0.01 (t-test; n = 3). (D) Gene expression according to RT-PCR analysis on day 10. Markers (stem cells: Oct4; proliferative epithelial: p63; dental epithelial: Krt14, p75, and tuftelin; and ameloblast: Amelx and Ambn). (E) Relative quantitative analysis of RT-PCR results. *, p < 0.05; **, p < 0.01 (t-test; n = 3) (F) Western blot on day 10. (G) Relative quantitative analysis of Western blot results. **, p < 0.01 (t-test; n = 3). (H) Real-time PCR of the BMP-Smad signaling pathway-associated molecules on day 10. **, p < 0.01 (t-test; n = 3).

