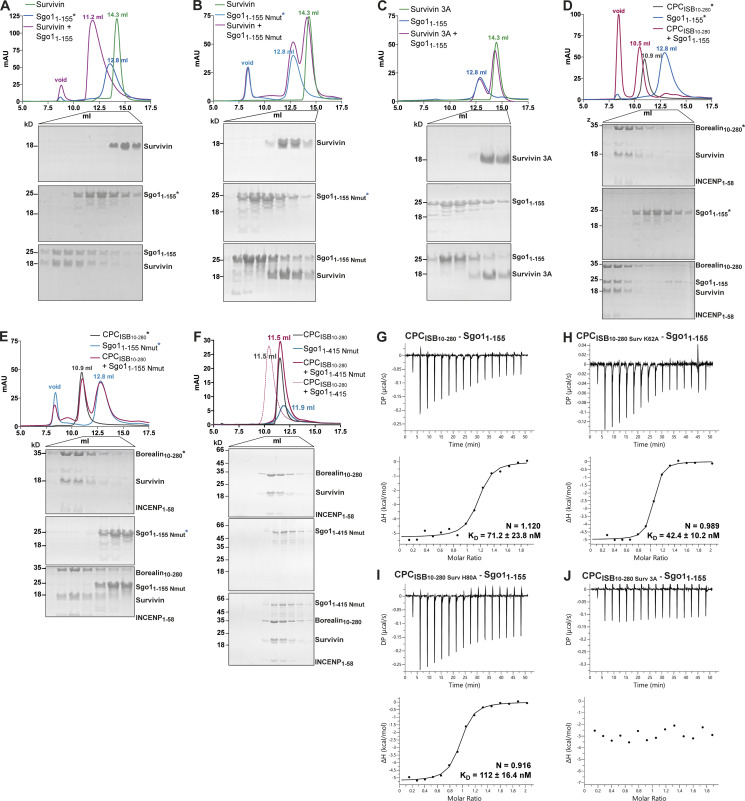
Figure 3.
Survivin interaction with Sgo1 N-terminal tail is essential for CPC–Sgo1 assembly. (A–F) SEC profiles (top) and corresponding representative SDS-PAGEs stained with Coomassie (bottom) for the analysis of Survivin and Sgo11–155 interaction (A); Survivin and Sgo11–155 Nmut interaction (B); Survivin 3A and Sgo11–155 interaction (C); CPCISB10–280 and Sgo11–155 interaction (D); CPCISB10–280 and Sgo11–155 Nmut interaction (E); and CPCISB10–280 and Sgo11–415 Nmut interaction (F). A Superdex S200 10/300 GL (Cytiva) column pre-equilibrated with either 25 mM Hepes, pH 7.5, 150 mM NaCl, 5% glycerol, and 4 mM DTT (A–E) or 25 mM Hepes, pH 8, 250 mM NaCl, 5% glycerol, and 2 mM DTT (F) was used. Elution volumes are indicated on top of the chromatogram peaks. For easy direct comparison, control SDS-PAGEs and chromatograms corresponding to Sgo11–155, Sgo11–155 Nmut, and CPCISB 10–280 (marked with an asterisk) are shown in two different panels in A and D, B and E, and D and E, respectively. (G–J) Isotherms for the analyses of Sgo11–155 interaction with CPCISB10–280 (G); CPCISB10–280 K62A (H); CPCISB10–280 H80A (I); and CPCISB10–280 3A (J). The ITC experiments were performed with 16 × 2.5-μl injections of 100 μM CPCISB10–280 variants into 200 μl of 10 μM Sgo11–155 (0.5 μl first injection), 180 s apart, at 20°C. Top panels show raw ITC data; bottom panels show integrated heat data corrected for heat of dilution and fitted to a standard 1:1 binding model (Malvern Instruments MicroCal Origin software, v1.3). DP, differential power; mAU, milli absorbance units. Source data are available for this figure: SourceData F3.

