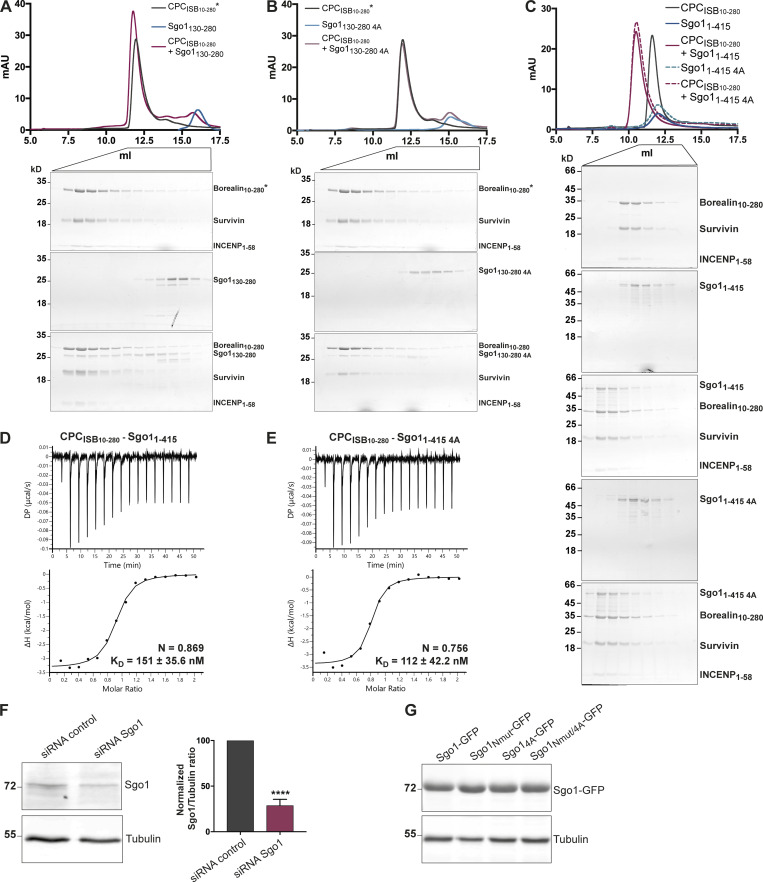
Figure S4.
Sgo1 central region does not significantly contribute to CPC binding in vitro. (A–C) SEC profiles (top) and corresponding representative SDS-PAGEs stained with Coomassie (bottom) for the analysis of CPCISB10–280 and Sgo1130–280 interaction (A), CPCISB10–280 and Sgo1130–280 4A interaction (B), and CPCISB10–280 and Sgo11–415 or Sgo11–415 4A interaction (C). For easy direct comparison, control SDS-PAGE and chromatogram corresponding to Sgo11–415 are shown in Figs. S2 A and S4 C. A Superdex S200 10/300 GL (Cytiva) column pre-equilibrated with 25 mM Hepes, pH 8, 150 mM NaCl, 5% glycerol, and 2 mM DTT was used for A and B and 25 mM Hepes, pH 8, 250 mM NaCl, 5% glycerol, and 2 mM DTT was used for C. For easy direct comparison, control SDS-PAGEs and chromatograms corresponding to CPCISB 10–280 (marked with an asterisk) are shown in two different panels, A and B. (D and E) Isotherms for the analyses of CPCISB 10–280 interaction with Sgo11–415 (D) and CPCISB 10–280 interaction with Sgo11–415 4A (E). 40 μl of 100 μM CPCISB 10–280 was injected into 200 μl of 10 μM Sgo11–415 or Sgo11–415 4A. The ITC experiments were performed with 16 × 2.5-μl injections (0.5 μl first injection), 180 s apart, at 20°C. Top panels show raw ITC data; bottom panels show integrated heat data corrected for heat of dilution and fitted to a standard 1:1 binding model (Malvern Instruments MicroCal Origin software, v1.3). (F) Representative immunoblot for the analysis of Sgo1 levels upon Sgo1 depletion using siRNA oligonucleotides. Quantification of Sgo1/Tubulin ratio using uncalibrated OD values (normalized Sgo1/Tubulin ratio for siRNA Sgo1 is 28.8 ± 6.6). Three independent experiments; mean ± SD; unpaired two-sided t test; ****, P ≤ 0.0001. (G) Representative immunoblot of Sgo1-GFP constructs (Sgo1-GFP, Sgo1Nmut-GFP, Sgo14A-GFP, or Sgo1Nmut/4A-GFP) showing comparable expression levels. DP, differential power; mAU, milli absorbance units. Source data are available for this figure: SourceData FS4.

