Figure S5.
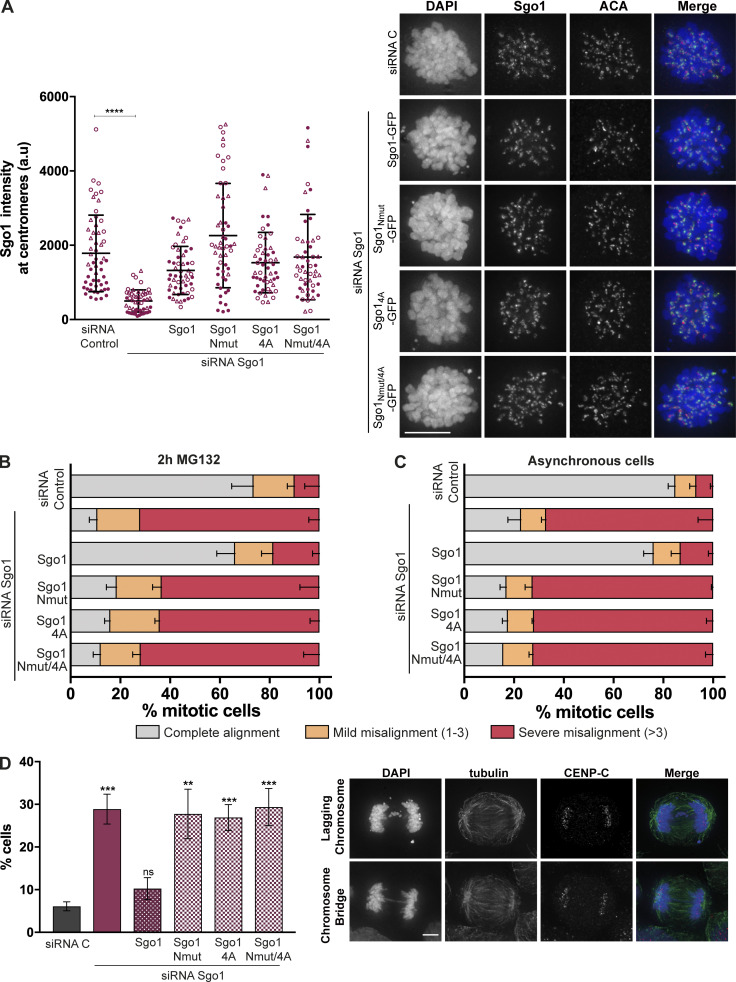
CPC interaction with Sgo1 N-terminal tail is crucial for accurate chromosome segregation. (A) Quantification of Sgo1 intensity at centromeres (left) and representative micrographs showing the localization of the transiently expressed Sgo1 mutant in comparison to the endogenous Sgo1 localization (right). Three independent experiments, n ≥ 50 cells analyzed in total per treatment, mean ± SD, Kruskal–Wallis with Dunn’s multiple comparisons test; ****, P ≤ 0.0001. The values from the three independent replicates are represented in three different symbols. Scale bar, 10 µm. (B and C) Quantification of chromosome alignment of cells subjected to biorientation assay. Transfected cells were treated with 100 μM Monastrol for 16 h and released into a medium containing 5 μM MG132 for 2 h (B) or left as unperturbed asynchronous cultures (C). Observed metaphases were classified as complete alignment, mild misalignment (with one to three misaligned chromosomes), and severe misalignment (with more than three misaligned chromosomes). Three independent experiments, n ≥ 100 of metaphases analyzed; mean ± SD. (D) Quantification of anaphase cells with lagging chromosomes or chromosome bridges for the siRNA-rescue assay of the Sgo1-GFP constructs: Sgo1-GFP, Sgo1Nmut-GFP, Sgo14A-GFP, or Sgo1Nmut/4A-GFP. Right: Representative examples of lagging chromosomes and chromosome bridges quantified. Three independent experiments, n ≥ 300 of anaphases analyzed; mean ± SD; χ2 test for differences between the indicated groups and the control, for % complete alignment; **, P ≤ 0.01; ***, P ≤ 0.001). Scale bar, 10 µm.

