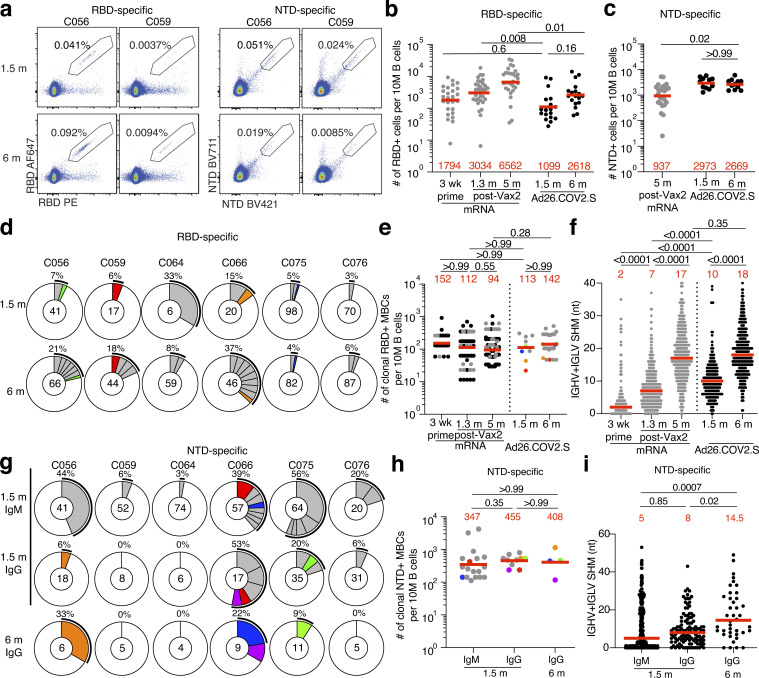
Figure 2.
Anti–SARS-CoV-2 RBD and NTD B cells after vaccination. (a) Representative flow cytometry plots showing dual Alexa Fluor 647– and PE-Wuhan-Hu-1 RBD-binding (left) and BrilliantViolet-711- and BrilliantViolet-421-Wuhan-Hu-1 NTD-binding (right), single-sorted B cells from two individuals 1.5 mo (m) or 6 mo after vaccination. Gating strategy shown in Fig. S2. Percentage of antigen-specific B cells is indicated. (b) Graph summarizing the number of Wuhan-Hu-1 RBD-specific B cells per 10 million (M) B cells in Ad26.COV2.S vaccinees 1.5 and 6 mo after vaccination (black dots, n = 18) compared with mRNA vaccinees at prime and 1.3 and 5 mo after Vax2 (Cho et al., 2021; gray dots). (c) Graph summarizing the number of Wuhan-Hu-1 NTD-specific B cells per 10 million B cells in Ad26.COV2.S vaccinees 1.5 and 6 mo after vaccination (n = 18), compared with mRNA vaccinees 5 mo after Vax2 (gray dots). (d) Pie charts show the distribution of IgG antibody sequences obtained from Wuhan-Hu-1 RBD-specific memory B cells from six individuals 1.5 and 6 mo after vaccination. Time points indicated to the left of the charts. The number inside the circle indicates the number of sequences analyzed for the individual denoted above the circle. Pie slice size is proportional to the number of clonally related sequences. The black outline and associated numbers indicate the percentage of clonally expanded sequences detected at each time point. Colored slices indicate persisting clones (same IGHV and IGLV genes with highly similar CDR3s; see Materials and methods) found at more than one time point within the same individual. Gray slices indicate expanded clones unique to the time point. White slice represents sequences isolated only once. (e) Graph shows the number of clonally expanded RBD-specific MBCs per 10 million B cells. Left panel represent clones from mRNA vaccinees after prime or 1.3 and 5 mo after Vax2 (black dots represent persisting clones; gray dots represent unique clones; Muecksch et al., 2022). Right panel show clones from Ad26.COV2.S vaccinees 1.5 or 6 mo after vaccination, with each dot representing one clone illustrated in panel d (color dots represent matched persisting clones; gray dots represent unique clones). (f) Number of nucleotide SHMs in IGHV and IGLV in RBD-specific sequences 1.5 or 6 mo after vaccination, compared with mRNA vaccinees (gray) after prime, or 1.3 and 5 mo after Vax2 (Cho et al., 2021). (g) Pie charts showing distribution of IgM and IgG Wuhan-Hu-1 NTD-specific sequences 1.5 and 6 mo after vaccination from the same individuals as shown in panel d. Isotype and time point is indicated to left of graphs. (h) Graph shows the number of clonally expanded NTD-specific MBCs per 10 million B cells, with each dot representing one clone illustrated in panel g (color dots represent matched persisting clones; gray dots represent unique clones). (i) Number of nucleotide SHMs in IGHV and IGLV in NTD-specific sequences 1.5 or 6 mo after vaccination. Red bars and numbers represent geometric mean (b, c, e, and h) or median (f and i) values. Statistical difference was determined by two-tailed Kruskal–Wallis test with subsequent Dunn’s multiple comparisons (b, c, e, f, h, and i).

