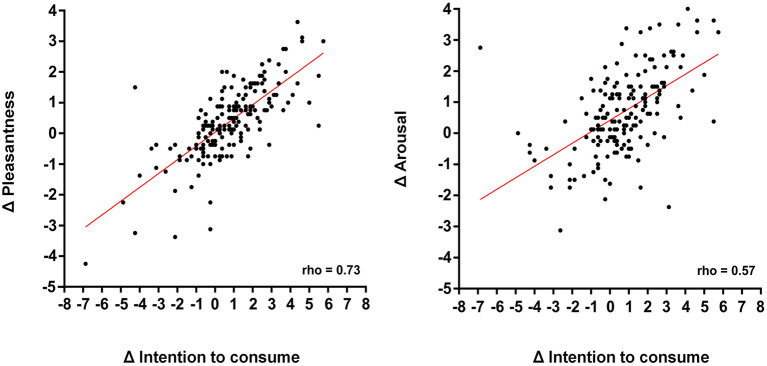
Figure 4.
Correlations between the emotional reactivity index obtained from pleasantness (left panel) and arousal (right panel) ratings and the index obtained from the “intention to consume” ratings. The index was calculated by subtracting the mean ratings assigned for the UMPF from the mean ratings assigned for the UPF (delta = UPF minus UMPF). UMPF, unprocessed/minimally processed foods; UPF, ultra-processed foods.

