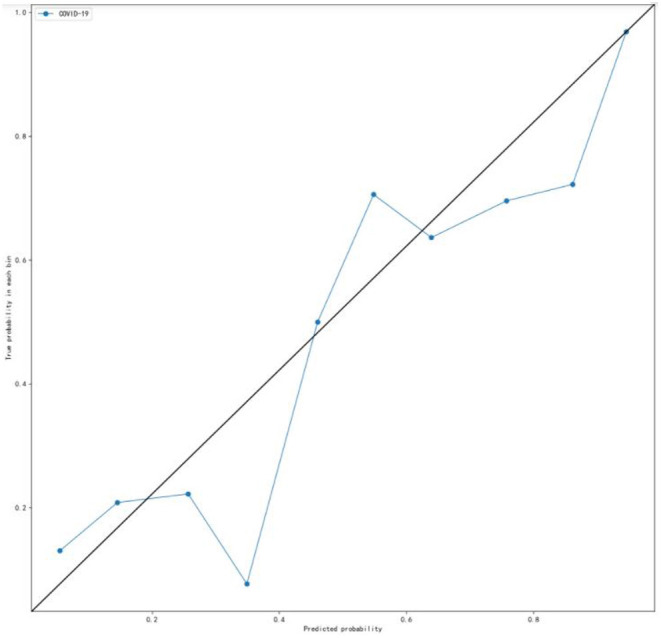
Figure 3.

Calibration curve for the internal validation set. The calibration curve was plotted using the bucket method (continuous data discretization) to observe whether the prediction probability of the classification model is close to the empirical probability (that is, the real probability). Ideally, the calibration curve lies along the diagonal (i.e., the prediction probability is equal to the empirical probability).
