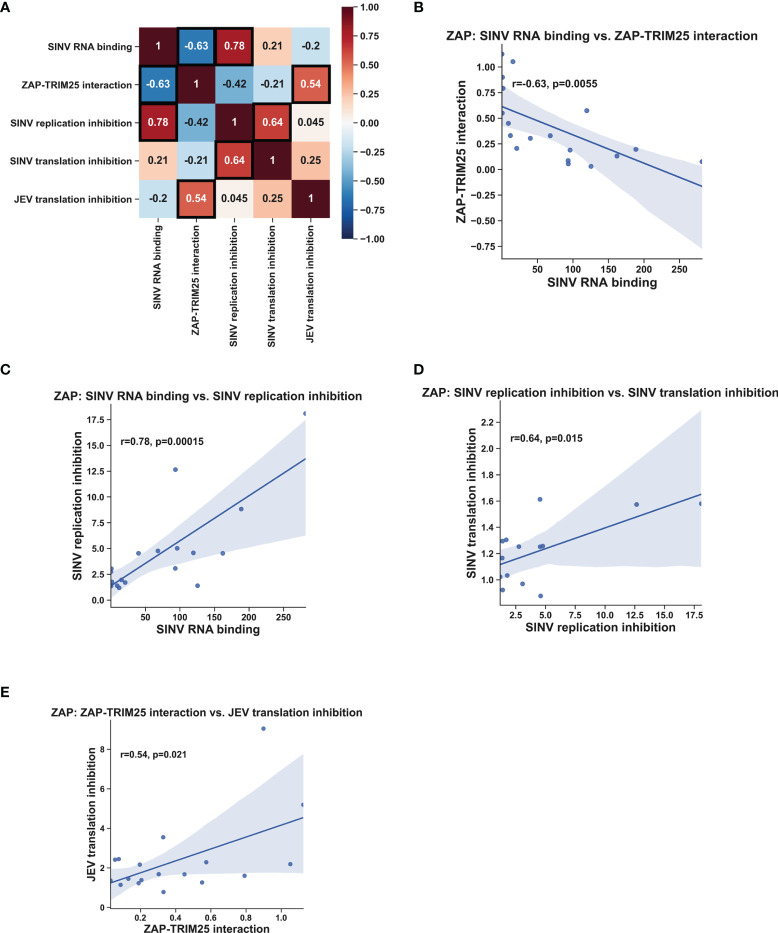
Figure 6.
Correlation analysis of ZAP RNA binding mutant phenotypes. Pearson correlation coefficients (r) and p-values (p) were calculated using the SciPy package in Python and plotted using the Matplotlib and Seaborn packages. Pearson correlation coefficients are summarized in a heat map (A). Boxed coefficients have statistically significant p-values (p < 0.05). Pairwise correlations with significant p-values from (A) are shown in (B–E).

