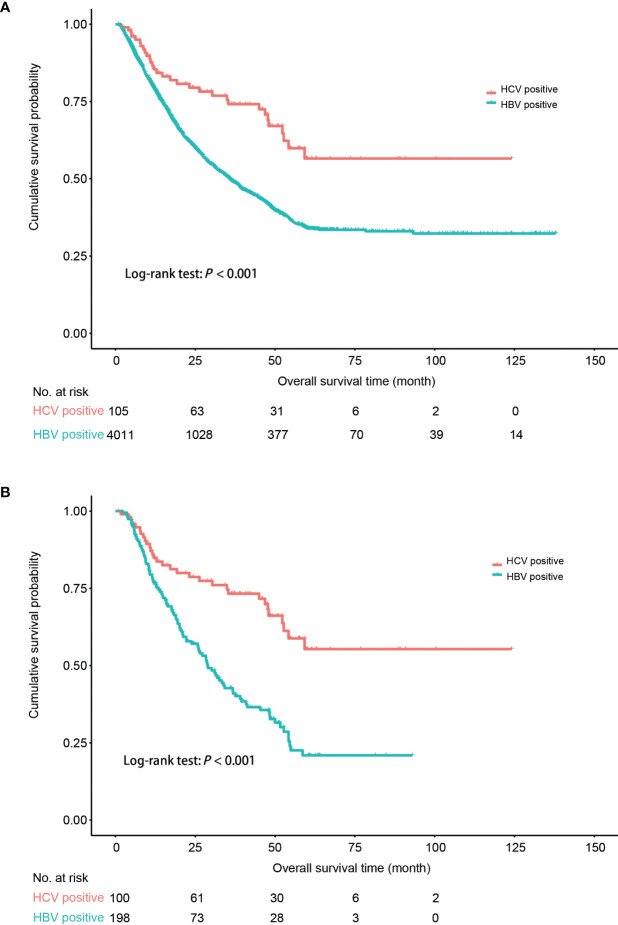
Figure 2.
Comparison of postoperative survival probability between HCC patients solely infected with HBV and HCC patients solely infected with HCV. (A) All the patients. (B) Patients following the 1:2 propensity score (PS) matching with age, gender, and BCLC stage. HBV, hepatitis B virus; HCV, hepatitis C virus; HCC, hepatocellular carcinoma. Kaplan–Meier curves were plotted to visualize the difference.

