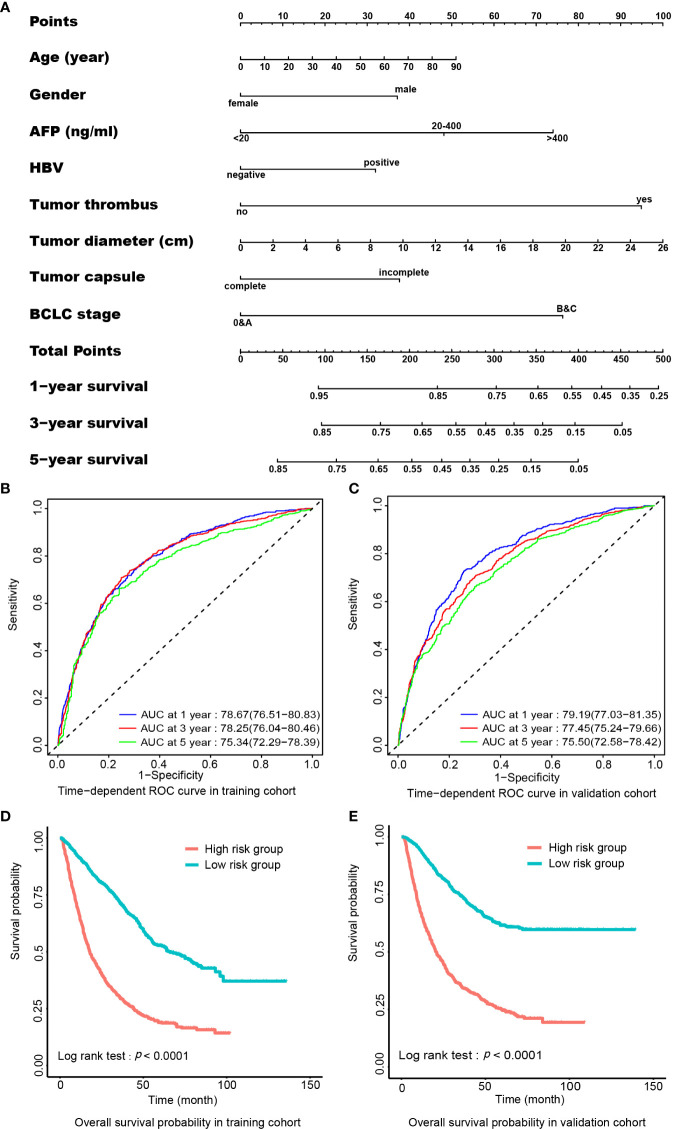
Figure 3.
Preoperative nomogram for predicting postoperative survival in HCC. (A) The nomogram. To use this nomogram, a patient’s value is located on each variable axis, and a line represents the number of points received for each variable value. The sum of the score of each indicator is located on”Total Points” axis, and the total point represents the likelihood of postoperative survival of 1-, 3-, or 5-year shown on the survival axes. (B) AUC of time-dependent ROC curve for 1-, 3-, or 5-year survival in the training cohort. (C) AUC of time-dependent ROC curve for 1-, 3-, or 5-year survival in the validation cohort. (D) Comparison of OS probability between low- and high-risk groups according to total points from nomogram in the training cohort. (E) Comparison of overall survival probability between low- and high-risk group according to total points from nomogram in the validation cohort. AFP, α-fetoprotein; AUC, area under the curve; BCLC, Barcelona Clinic Liver Cancer; HBV, hepatitis B virus; HCC, hepatocellular carcinoma; OS, overall survival; ROC, receiver operating characteristics.

