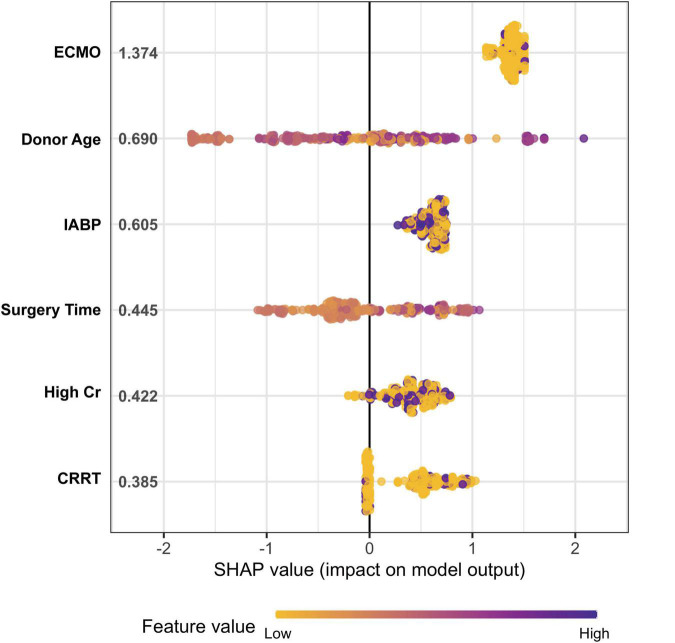
FIGURE 4.
The importance rank and hazard ratio of selected features using SHAP. The importance rank of selected features. Each point in the figure is a feature value of a particular training example. The color of the point represent the feature value and the X-axis position of the point is its SHAP value. The features are ranked by the sum of SHAP value magnitudes over all samples.

