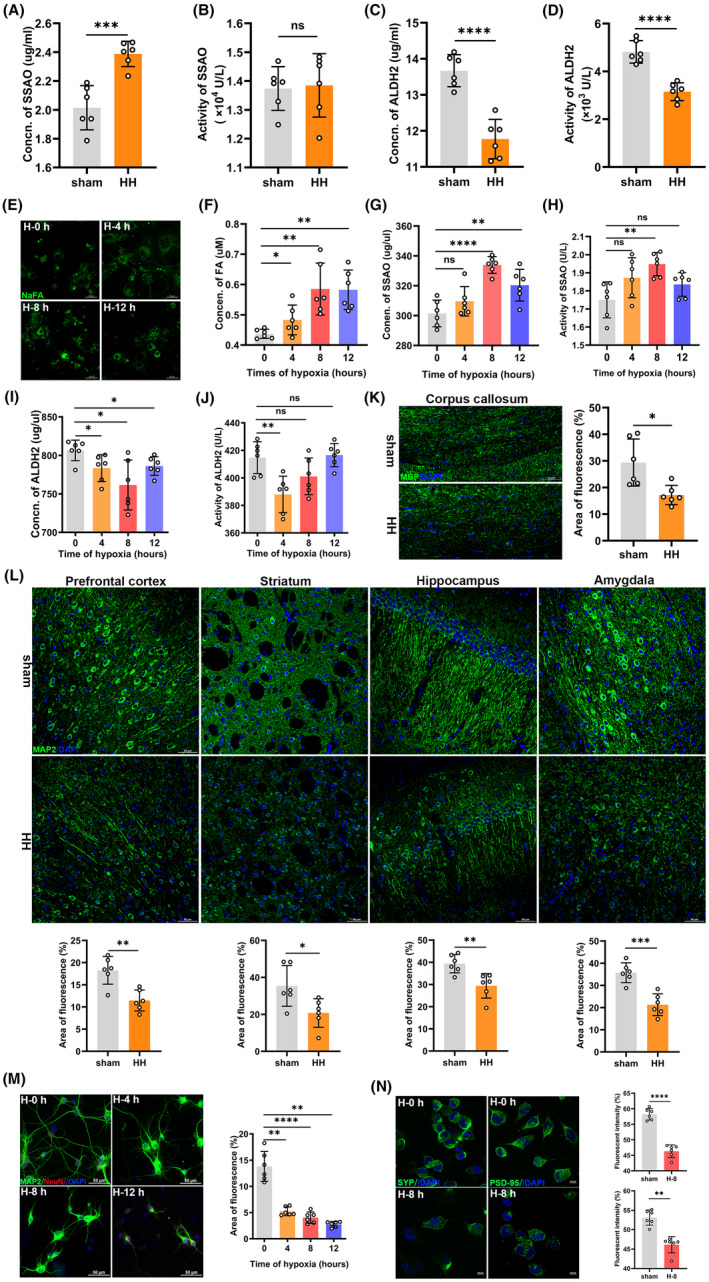
FIGURE 2.

Acute hypobaric hypoxia induced formaldehyde (FA) accumulation by disturbing FA metabolism in vivo and in vitro, and induced subsequent neuronal injuries. Change of the expression (p = 0.0004) (A) and activity (p = 0.8455) (B) of SSAO in the cerebrum of the mice under acute hypobaric hypoxia. Change in the level (p < 0.0001) (C) and activity (p < 0.0001) (D) of ALDH2 in the cerebrum of the mice after acute hypobaric hypoxia. (E) Cytoplasmic FA of primary neurons after 0, 4, 8, and 12 h hypoxia detected by confocal imaging with NaFA. Scale bar = 20 μm. (F) Neuronal FA detected by QuantiChrom FA assay kit (H‐0 h vs. H‐4 h, p = 0.0260; H‐0 h vs. H‐8 h, p = 0.0022; H‐0 h vs. H‐12 h, p = 0.0022). Changes of the expressions (H‐0 h vs. H‐8 h, p < 0.0001; H‐0 h vs. H‐12 h, p = 0.0075) (G) and activities (H‐0 h vs. H‐8 h, p = 0.0022; H‐0 h vs. H‐12 h, p = 0.1102) (H) of SSAO in the primary neurons after hypoxia. Changes of the concentrations (H‐0 h vs. H‐4 h, p = 0.0279; H‐0 h vs. H‐8 h, p = 0.0105; H‐0 h vs. H‐12 h, p = 0.0201) (I) and activities (H‐0 h vs. H‐4 h, p = 0.004) (J) of ALDH2 in the primary neurons after hypoxia. (K) Changes of the white matter injury of corpus callosum detected by MBP (green), DAPI (blue, a dye for nuclear), using confocal imaging (p = 0.0107). Scale bar = 50 μm. (L) Changes of the neuronal injuries in prefrontal cortex (p = 0.0017), striatum (p = 0.0235), hippocampus (p = 0.0052), and amygdala (p = 0.0003) detected by MAP2 (green) using confocal imaging. Scale bar = 50 μm. (M) Changes of primary neurons quantified by area of fluorescence of MAP2 (H‐0 h vs. H‐4 h, p = 0.0022; H‐0 h vs. H‐8 h, p < 0.0001; H‐0 h vs. H‐12 h, p = 0.0022). Scale bar = 20 μm. (N) Changes of presynaptic protein (H‐0 h vs. H‐8 h, p < 0.0001) and postsynaptic protein (H‐0 h vs. H‐8 h, p = 0.0022) quantified by fluorescent intensity of SYP and PSD‐95 respectively. Scale bar = 20 μm. FA, formaldehyde; sham, unexposed control group; HH, acute hypobaric hypoxic group; SSAO, semicarbazide‐sensitive amine oxidase; ALDH2, aldehyde dehydrogenase 2. H‐0 h, hypoxia for 0 h; H‐4 h, hypoxia for 4 h; H‐8 h, hypoxia for 8 h; H‐12 h, hypoxia for 12 h; MBP, myelin basic protein; MAP2, microtubule‐associated protein 2; DAPI, 2‐(4‐Amidinophenyl)‐6‐indolecarbamidine dihydrochloride; SYP, synaptophysin; PSD‐95, postsynaptic density 95. N = 6 in each group, with three independent experiments. Data are presented as mean ± SD. ns: p > 0.05; *p < 0.05, **p <0.01, ***p < 0.001, ****p < 0.0001
