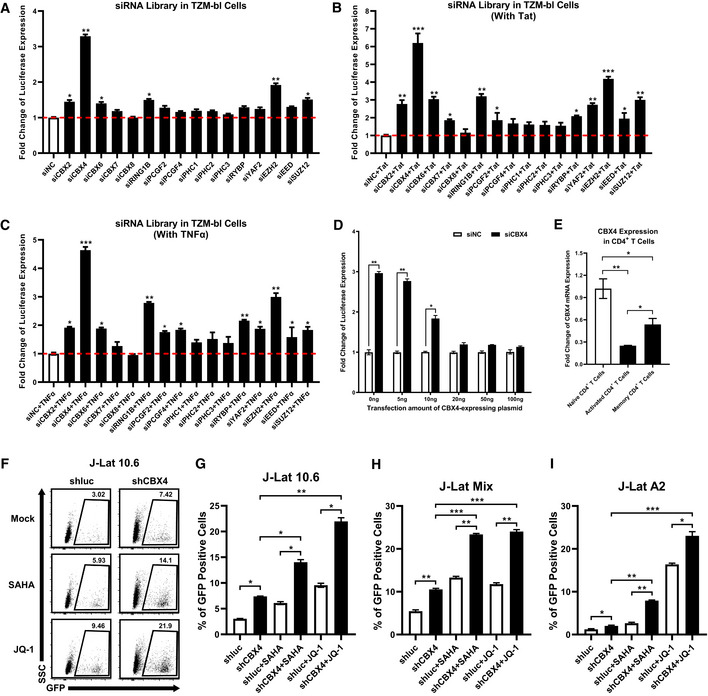
Figure 1. CBX4 contributes to HIV‐1 latency.

-
AAn siRNA library targeting major PcG proteins was transfected into TZM‐bl cells. Three different siRNAs targeting each gene were transfected as a mixture. Forty‐eight hours post transfection, cells were harvested and lysed, followed by measuring the luciferase activity of each group. Fold changes of luciferase expression were calculated for each gene by normalizing to the negative control siNC. The red dashed line represents the base line.
-
BDifferent siRNAs targeting each gene were transfected as in (A). Twenty‐four hours post siRNA‐transfection, cells in each group were transfected with equal amounts of Tat‐expressing plasmids. Another 24 h later, cells were proceeded to luciferase assay.
-
CsiRNAs targeting different genes were transfected into TZM‐bl cells as in (A). About 24 h later, cells were treated with TNFα. Another 24 h later, cells were proceeded to luciferase assay.
-
DThe endogenous CBX4 in TZM‐bl cells were knocked down by three different siRNAs targeting 3’UTR of CBX4 mRNA, or treated with siNC. Different gradients of CBX4 construct were co‐transfected. The expression of luciferase from each group was measured and normalized to the siNC group which was not co‐transfected with CBX4 construct.
-
ETotal RNAs from naïve CD4+ T cells, PHA‐stimulated CD4+ T cells and resting memory CD4+ T cells were extracted and proceeded to RT‐qPCR to quantitate the relative expression of CBX4. The expression of CBX4 in PHA‐stimulated and resting memory CD4+ T cells was normalized to naïve CD4+ T cells.
-
F, GThe percentages of GFP‐positive J‐Lat 10.6 cells in shluc and shCBX4 groups. LRAs SAHA and JQ‐1 were used as supplements. The representative flow cytometry figure of each group is shown in (F). The overall statistical results are shown in (G).
-
H, IOne heterogeneous latency model J‐Lat Mix and one monoclonal model J‐Lat A2 were treated as in (F). The reactivation efficiencies of each group are indicated by the percentages of GFP‐positive cells.
Data information: Data are presented as mean ± SEM in biological triplicate. P‐values in (A–C) were calculated by one‐way ANOVA with Dunnett's multiple comparisons test. P‐values in (D) were calculated by two‐way ANOVA with Sidak's multiple comparisons test. P‐values in (E–I) were calculated by one‐way ANOVA with Tukey's multiple comparisons test. *P < 0.05, **P < 0.01, ***P < 0.001.
