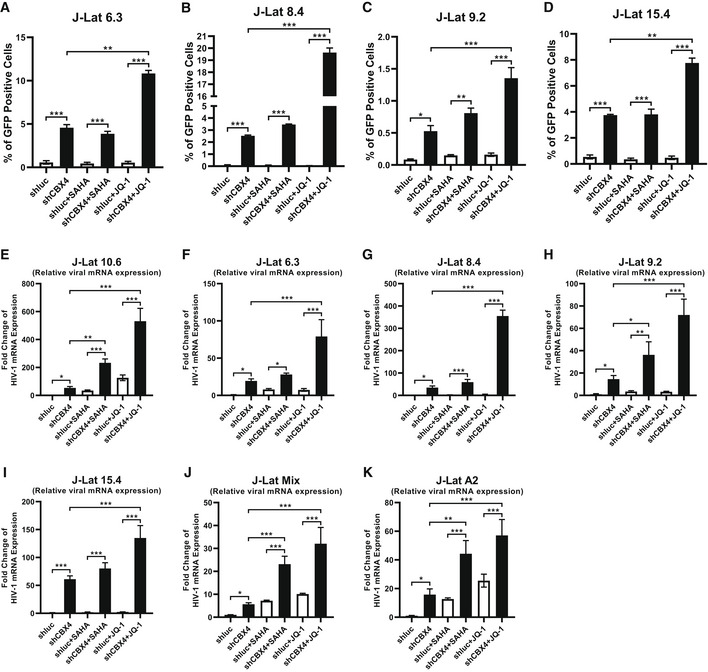
Figure EV1. CBX4 depletion reactivates latent HIV‐1.

-
A–DMonoclonal latency models including J‐Lat 6.3, 8.4, 9.2 and 15.4 were treated as in Fig 1F. The reactivation efficiencies of each group are indicated by the percentages of GFP‐positive cells.
-
E–KJ‐Lat 10.6, 6.3, 8.4, 9.2, 15.4, Mix and A2 were treated as in Fig 1F. Relative HIV‐1 mRNA expression within each group was quantified and normalized to the shluc group in each cell line.
Data information: Data are presented as mean ± SEM in biological triplicate. P‐values were calculated by one‐way ANOVA with Tukey's multiple comparisons test. *P < 0.05, **P < 0.01, ***P < 0.001.
